Week 4: Question-Focused Analysis
Agenda
Identify a question
Develop a hypothesis
Tell the story with your data
Brainstorm project ideas
By the end of today’s lecture…
Selected a scenario (question) that you will answer for project 00 (problem set 4), applying the D3M process, principles of data storytelling, and guidelines for creating effective data visualizations.
We will spend Friday’s lab working on building your data story to answer the question you choose.
Identify a question
A question might be driven by a business decision or goal. Examples:
We need to cut costs. Can we reallocate labor more efficiently?
We want to increase profits. Can we increase marketing efforts on profitable product lines?
Refine the question
Ask yourself:
- Can we answer the question with the available data? If not, we should adjust the question or collect more data.
- Is the question specific enough? Example: Instead of “Is climate change impacting agriculture?”, ask “How are Colorado corn growers adapting to water shortages expected to increase due to climate change?”
- Will the answer explain a phenomenon? Example: Are growers adopting more efficient irrigation technologies? Are they selling farmland and exiting agriculture?
What questions can we answer with the supermarket_sales dataset?
- Can we optimize staffing schedules to reduce labor costs?
- No. The dataset does not include employee schedules or wages, so we may need additional data.
- However, we can analyze peak sales hours to estimate when more staff may be needed.
What questions can we answer with the supermarket_sales dataset?
- Which product lines contribute most to total revenue, and can we improve marketing efforts for them?
- Yes. The dataset includes sales by product line, so we can analyze revenue contributions.
- We can also examine purchase trends over time to identify the best periods for targeted marketing campaigns.
Develop a hypothesis
What do you think the answer is?
Why? \(\rightarrow\) Describe the mechanism.
The why part of your answer will help guide your analysis of the data.
Let the question drive the analysis
Think through how you can analyze the data to answer your question.
The evidence should support your conclusions.
Example Analysis
We have a limited budget for a promotional campaign.
Questions:
Which product(s) have a high customer rating by customer type?
What day of the week do members buy those products?
What kind of visuals will help you answer these questions?
Example Analysis - Data Visuals
Which product(s) have a high customer rating by customer type? 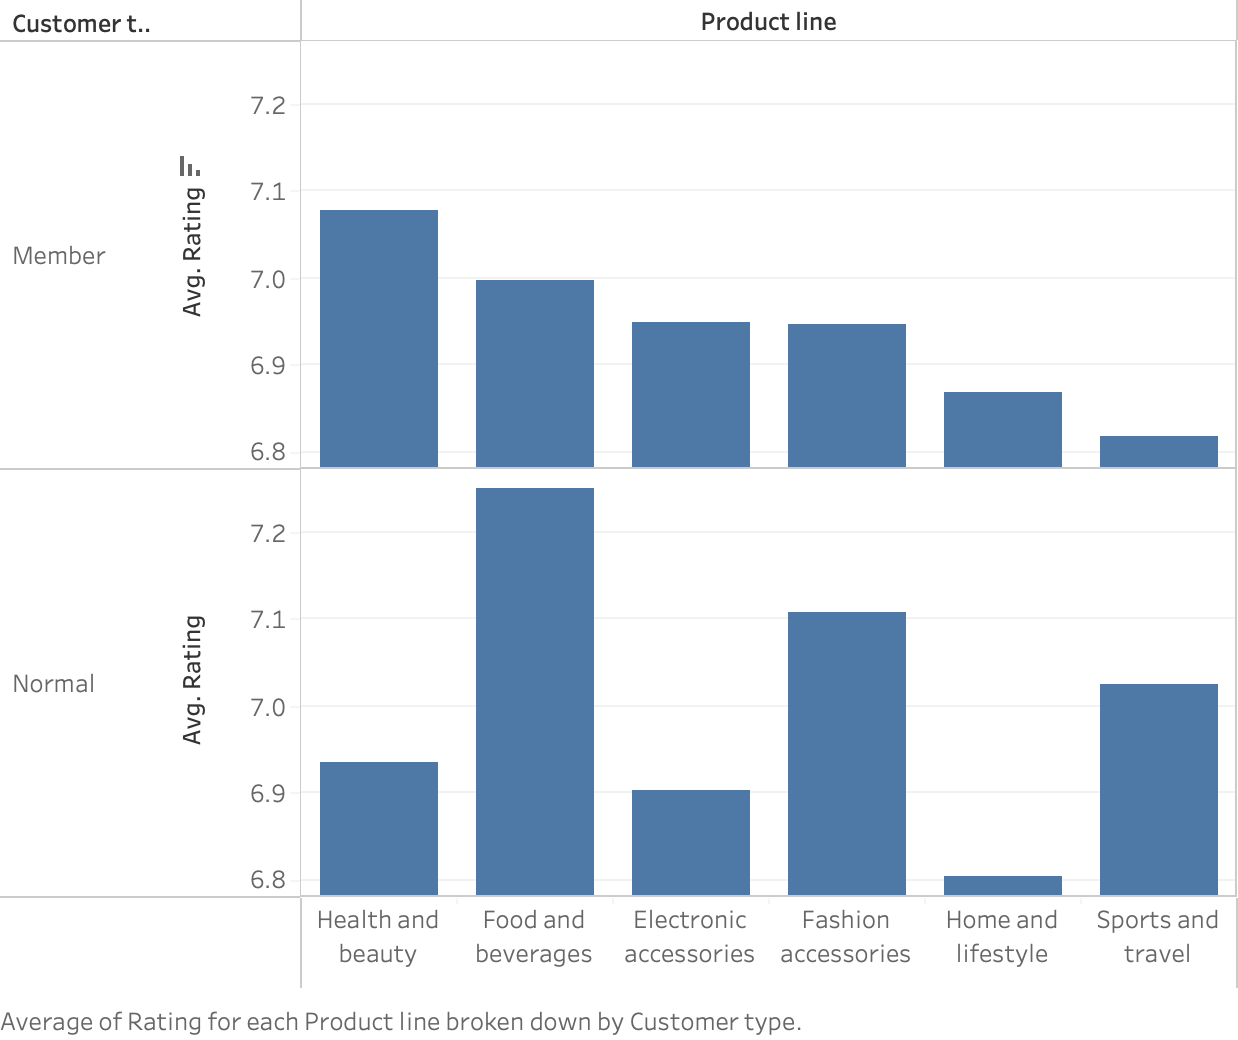
What day of the week do members buy those products? 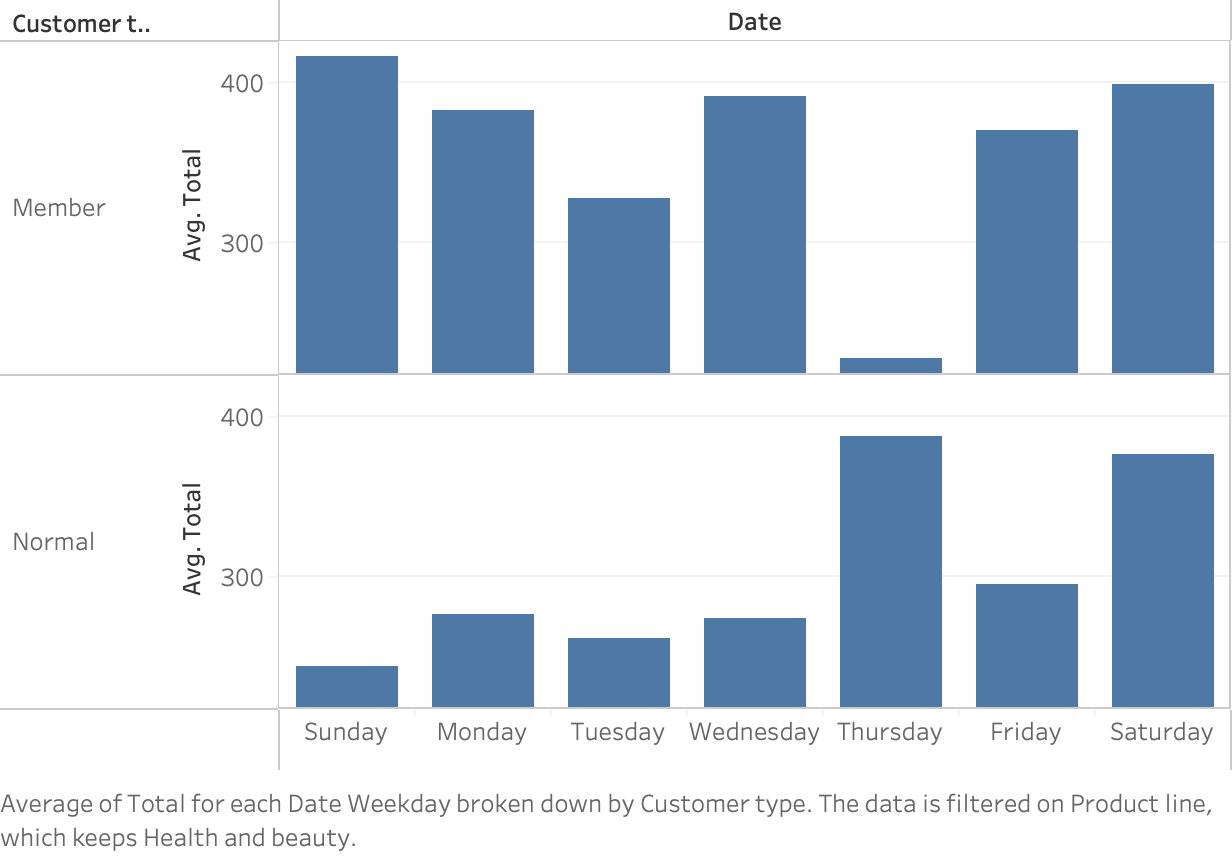
Further exploration
What else might you investigate during your exploratory data analysis (EDA)?
Does this vary by city/branch?
Does this vary by gender?
Does this vary by payment type?
Keep a record of your exploration
Keep a notebook as you explore your dataset, especially in Tableau.
Document your thought process–this will help you tell your data story.
Know when to quit
Data analysis can be fun–you may be tempted to keep checking new things.
Stay focused on your question and quit when you have answered it.
Tell the story with data
Develop a narrative.
Create effective visuals.
Story structure
Start with the question–Sometimes you won’t have a clear question, but you are communicating an insight that requires audience engagement.
Characters and setting–Who and what is involved?
Preliminaries–Provide supporting evidence before revealing the main finding.
Answer (or insight)–Clearly show your main result.
Next steps–Suggest recommendations or further investigation.
Limitations–Understand and communicate the limitations of your analysis.
Example Storytelling - Our Analysis
1. Question
Which product(s) have a high customer rating by customer type?
What day of the week do members buy those products?
2. Characters and context
Who are the characters?
- Customers: the members and non members
What is the setting?
Sales in Q1 2019 at three branch locations
Transaction-level data, where customers rate the product and buying experience after a purchase
3. Preliminaries
You will often need to set up your main point with supporting evidence.
- Start with a big-picture view.
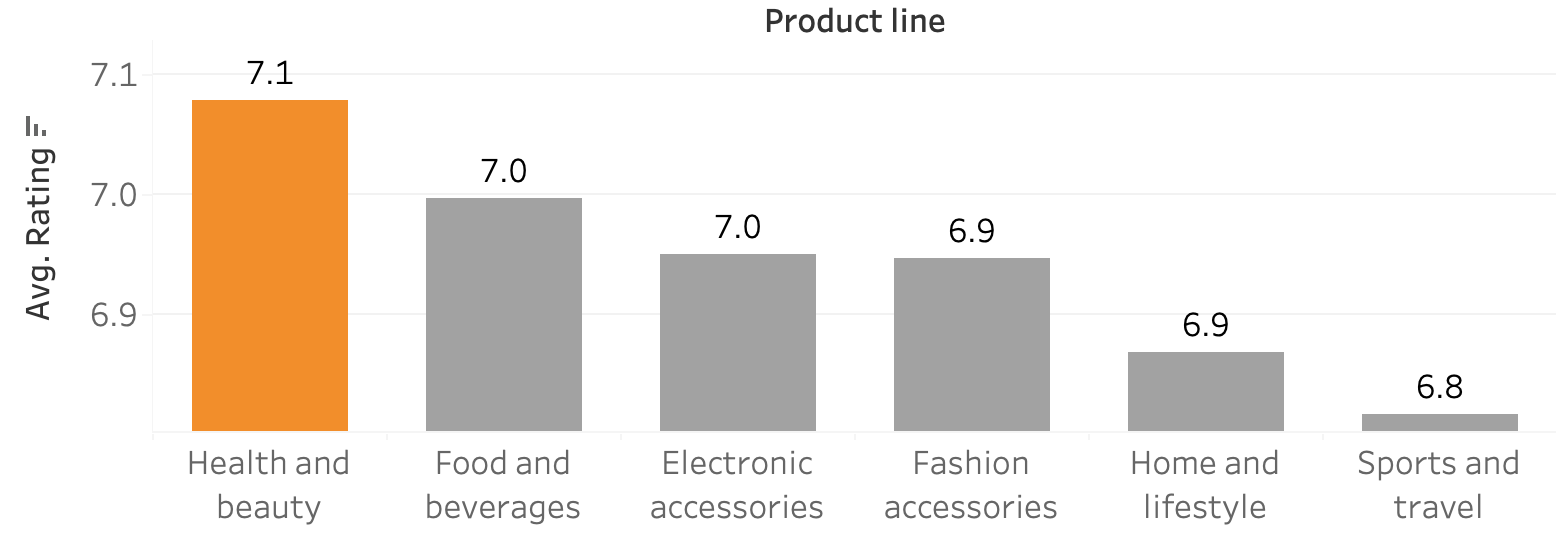
- In this example, start with a visual depicting sales by product category
Then, drill down into the details.
4. Key insight or answer
Your key insights is the most important part of your story.
Make sure the visual is effective.
Does your visual clearly illustrate the point?
Members rate health and beauty products highest among categories
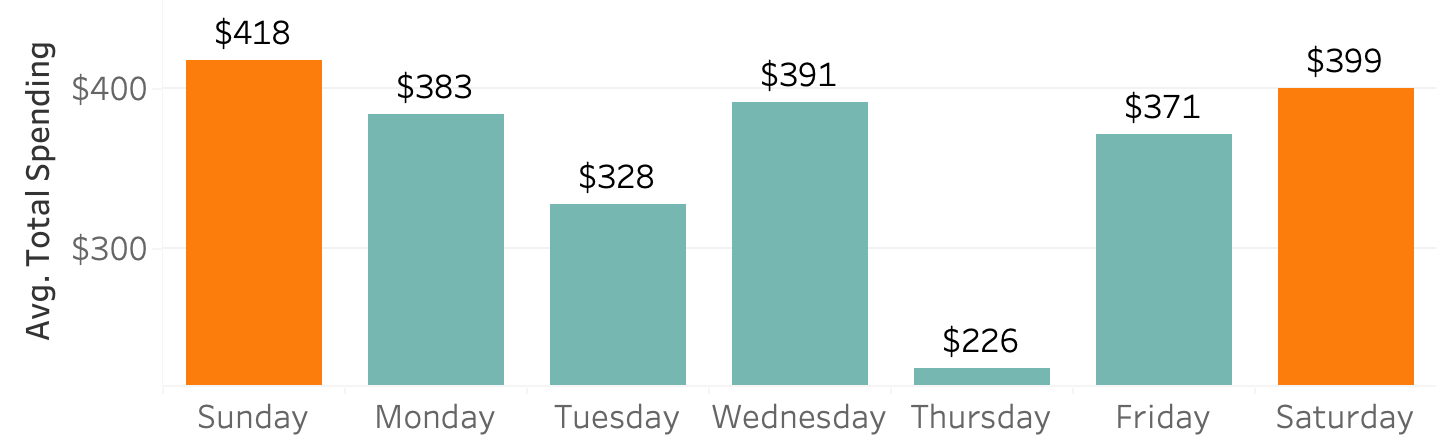
Members spend more on health and beauty products on the weekend
5. Next steps
Make recommendations (if appropriate)
- In some cases, it may not be appropriate for you to make direct recommendations. Try to frame the discussion.
Identify additional analyses if needed.
Example analysis:
- Design promotions for health and beauty products on the weekend.
- Conduct market survey to better understand why members purchase these items on the weekend.
6. Limitations
Understanding the limitations of your analysis, and communicating them, helps ensure transparency and prevents overgeneralization of your findings.
Are there any data limitations (e.g., missing variables, small sample size, outdated information)?
Could there be biases in the data collection process or analysis?
What external factors might influence the results that were not accounted for?
Brainstorm project ideas
Here are some example project questions:
Understanding Customer Behavior
- What are the most popular product lines, and how frequently do customers purchase them?
Sales & Revenue Analysis
- How do total sales and the share of revenue generated by different store branches change over time?
Customer Segmentation
- How do purchasing behaviors differ by customer demographics, such as gender and customer type?
Spending Methods
- Which payment methods are most effective in contributing to sales, and how should payment methods be adjusted?
Customer Satisfaction Analysis
- How do factors such as product line, time of purchase, payment method, and store location impact customer ratings?
References
Dykes, B. (2019). Effective Data Storytelling: How to Drive Change with Data, Narrative and Visuals (1st edition). Wiley.