Week 5:
Intro to Time Series
and Project 1 Overview
Plot Comparison
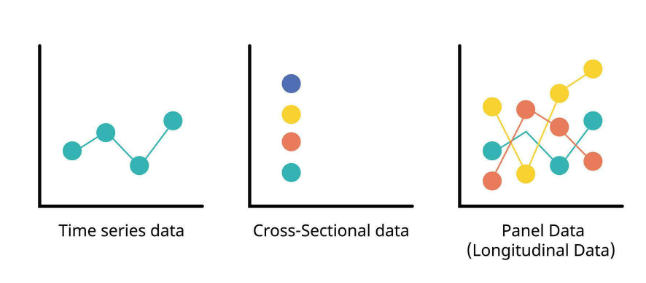
What is time series data?
Time series data is a sequence of data points collected over time.
It typically consists of observations taken at regular intervals (e.g. every hour, every day, every week, etc.) and can be used to study trends and patterns over time.
Example: Store sales volume over time.
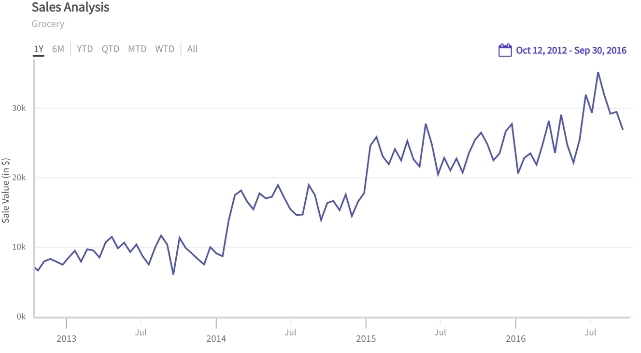
Example
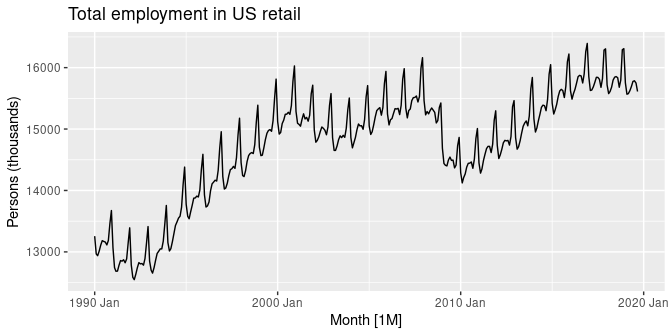
Structural breaks
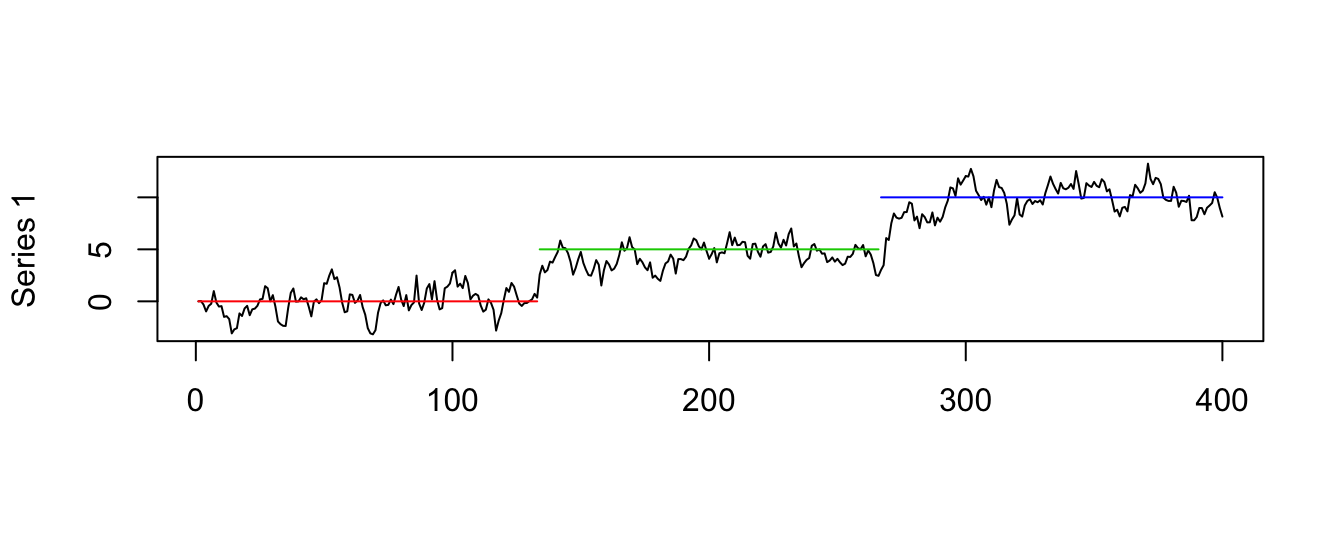
Sometimes, data doesn’t follow a smooth pattern—something big happens, and the trend changes suddenly.
These major shifts in the data are called structural breaks.
A structural break occurs when there is a sudden and lasting change in how the data behaves. This means the underlying factors driving the data (also called the data-generating process) have changed.
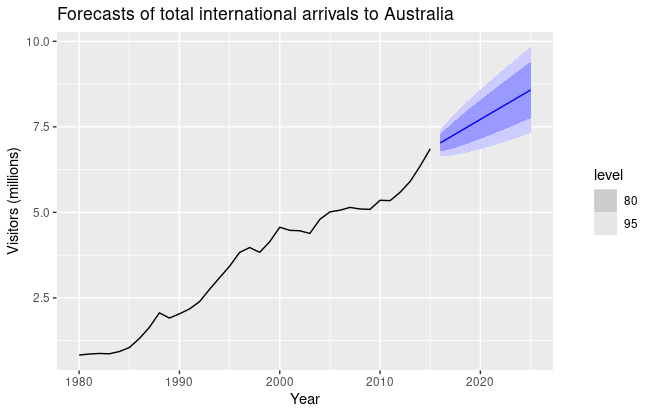
Forecasting overview
Use historical data to develop a model, then use the model to predict the future
Model quality depends on past data and assumptions
Forecasts are uncertain; we can quantify some of that uncertainty
Example: Corn and Combines
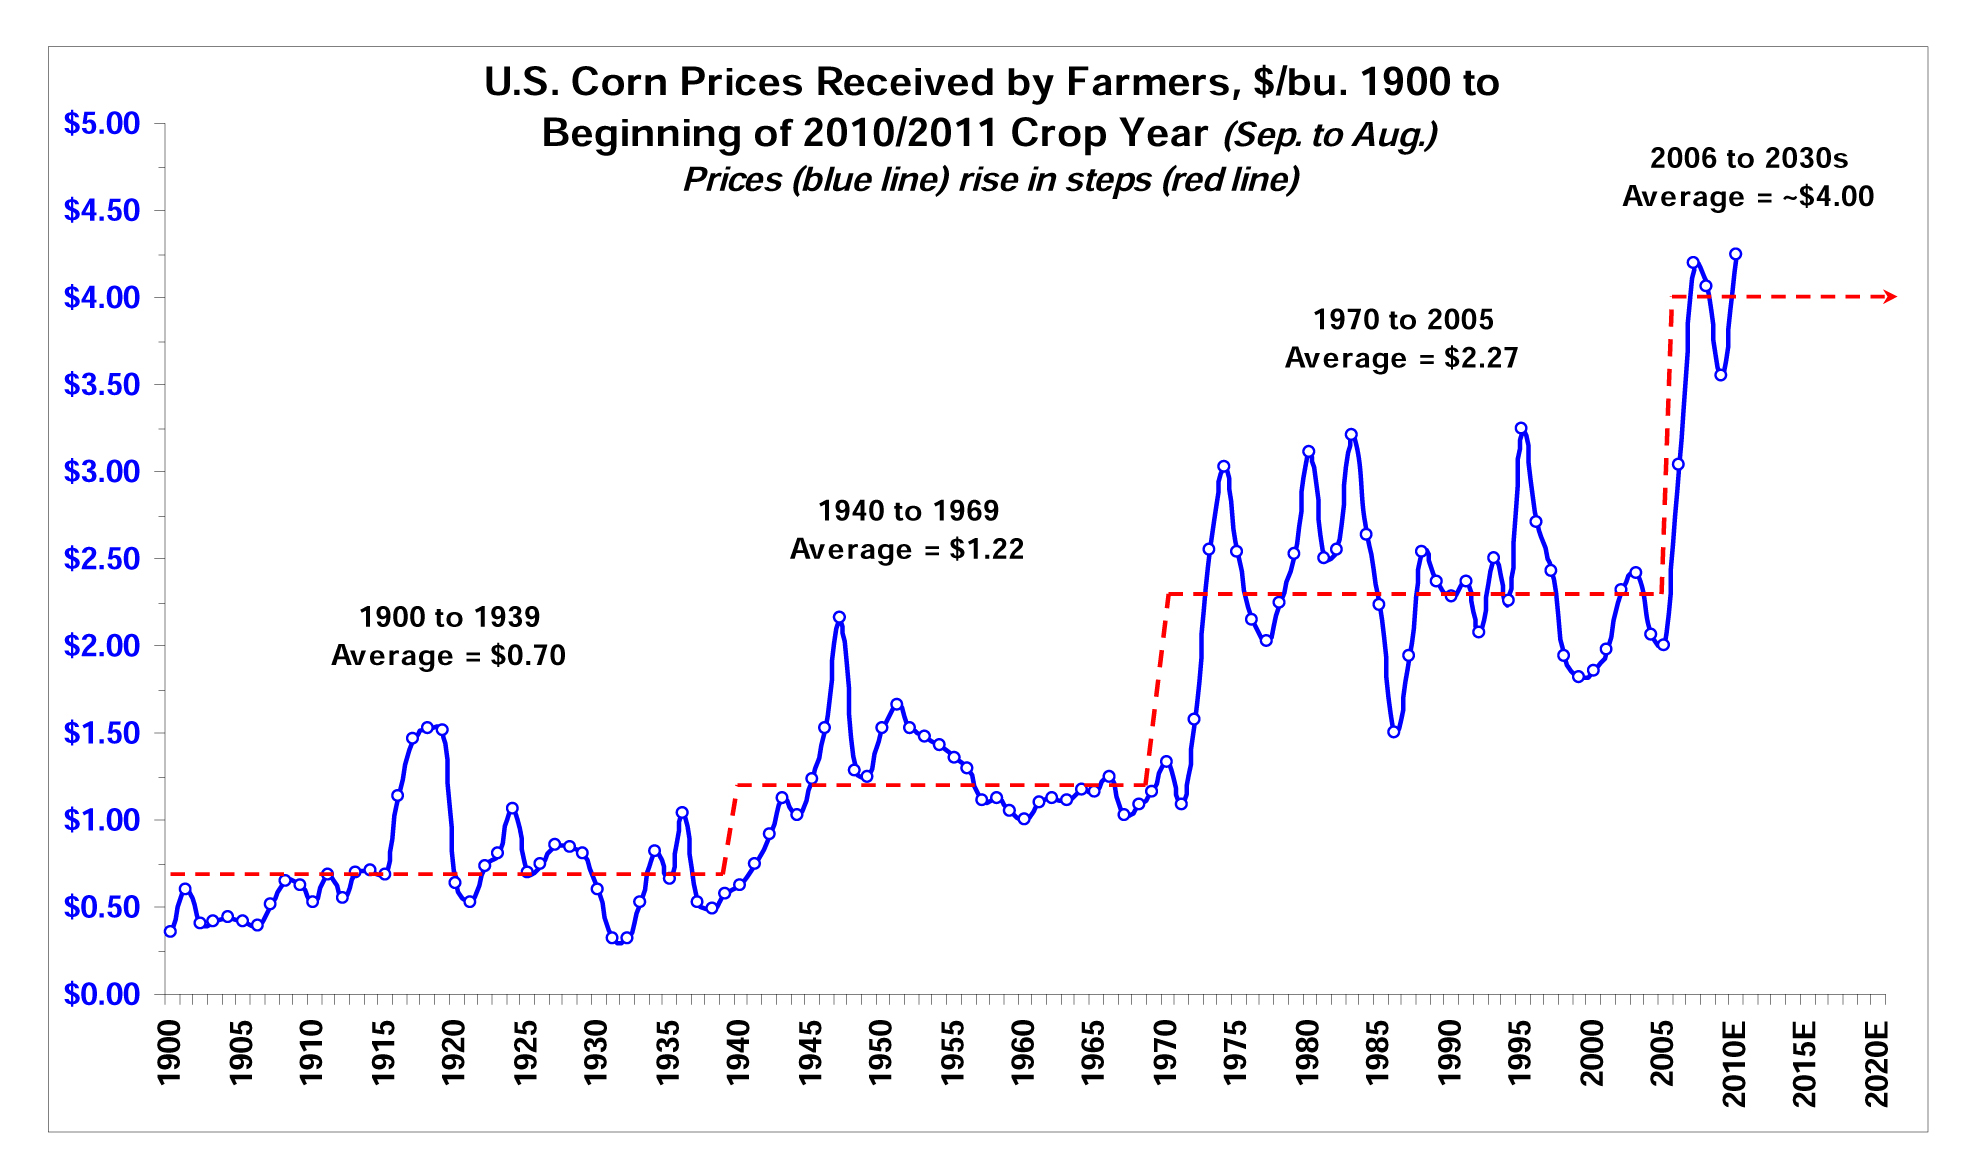
Story: Corn prices have historically risen in stepwise jumps rather than gradual increases, with structural breaks around 1940, 1970, and 2006. Each break led to a new, higher average price level.
Result: If corn prices continue following this pattern, Dealer X should consider increasing equipment inventory to meet anticipated higher demand from farmers who will have greater revenues to invest in new machinery.