Week 6:
Intro to Trends and Forecasting
Agenda
- Understanding time series decomposition
- Components of time series
- Interpreting decomposition results
- Applications in forecasting
- Interactive group exercises
Time Series Decomposition
Why decompose a time series?
Time series data often contain patterns that we can break down into different components.
Decomposition allows us to separate these components to better understand underlying trends and improve forecasting.
Components of Time Series
Recall that a time series is often composed of:
- Trend (T) – The long-term pattern of increase or decrease.
- Seasonality (S) – Regularly repeating patterns over time.
- Residual (R) – Random noise or unexplained variation.
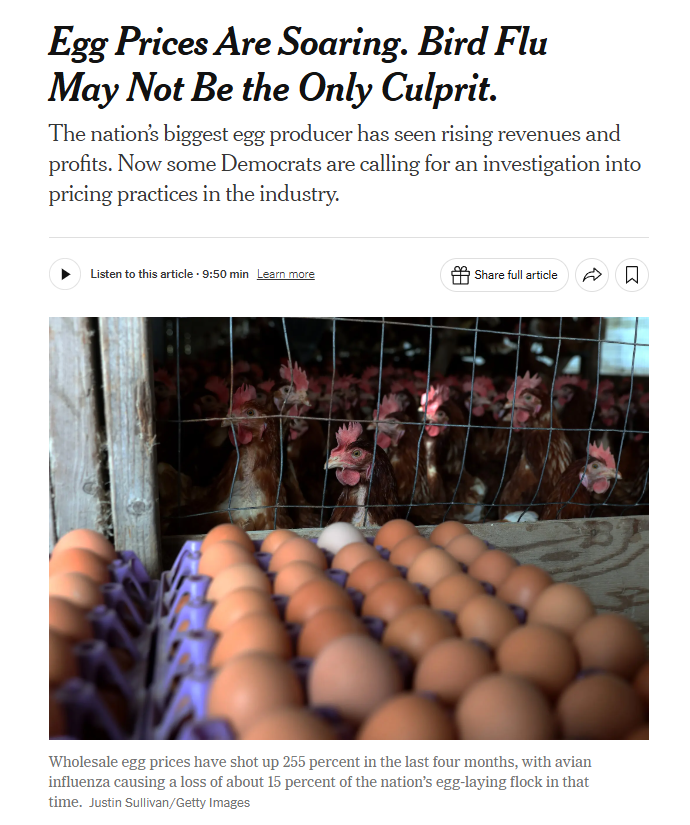
Example: Why Decomposition Matters
Consider monthly egg prices over several years. Prices fluctuate due to multiple factors:
- A long-term trend: We expect a gradual increase in price.
- A seasonal pattern: We expect prices rise before holidays and drop afterward.
- Random variations: We expect random market disruptions or supply chain issues to affect prices.
By decomposing the time series, we can isolate these effects and make better predictions.
Example: Egg Price Decomposition

This plot helps us:
- Identify long-term trends in egg prices.
- Recognize seasonal price spikes.
- Spot unexpected deviations that might indicate market disruptions.
How Decomposition Works
We assume that a time series can be expressed as either an additive or multiplicative model.
The outcome we are modeling is the observed value of a time series at a specific point in time.
Additive Model (when variations remain constant)
\(Y_t = T_t + S_t + R_t\)
Where:
- \(Y_t\) is the recorded data at a given time
- \(T_t\) is the trend component
- \(S_t\) is the seasonal component
- \(R_t\) is the random component
Decomposition helps us break down the value of \(Y_t\) into meaningful components.
Example: Additive Model
Suppose we analyze monthly sales of a product:
- Sales have been increasing by $1,000 per month.
- A holiday effect adds $500 in December and subtracts $300 in January.
- Random variations range between -$200 and $200.
Question: If the baseline sales in January 2023 were $10,000, what would the expected sales be in December 2023?
Example: Additive Model
Using the given trend and seasonal components, we can write our time series decomposition as:
\(Y_{Dec} = 10,000 + (1,000 \times 11) + 500 + R\)
- $10,000 is the baseline sales in January 2023. This is included because it is the initial sales before any trend, seasonal, or random effects are applied.
- (\(1,000 \times 11\)) is the increase of $1,000 per month for 11 months (from February to December). This is the trend accumulation.
- 500 is a holiday seasonal effect that increases sales in December. This is the seasonal effect for December.
- \(R\) is a random variation (which we assume is 0 for now).
Answer: \(Y_{Dec} = \$21,500\)
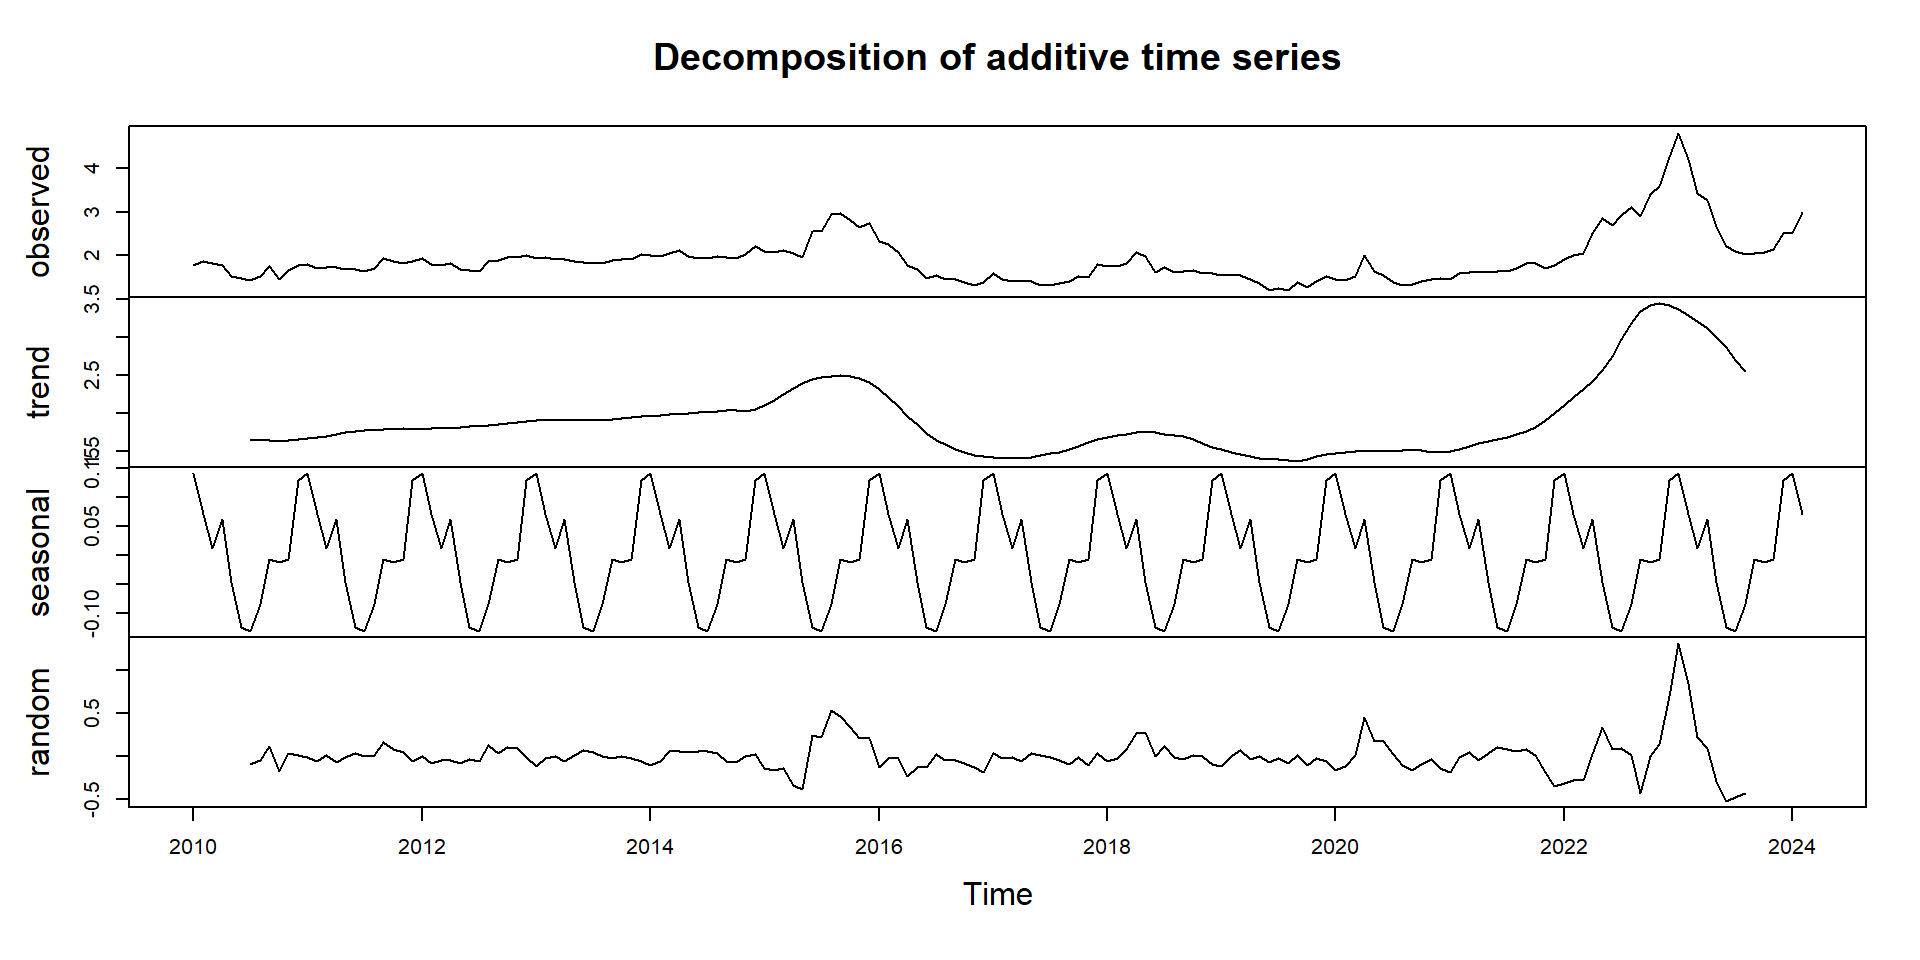
Egg Example: Revisited (Additive Model)
Multiplicative Model (when variations scale with the trend level)
\(Y_t = T_t \times S_t \times R_t\)
Where:
- \(Y_t\) is the recorded data at a given time
- \(T_t\) is the trend component
- \(S_t\) is the seasonal component
- \(R_t\) is the random component
The multiplicative model is often used when seasonality effects increase proportionally with the trend.
Example: Multiplicative Model
Suppose a company’s revenue…
- grows 5% each month (trend), and
- there is a seasonal multiplier of 1.2 in December and 0.9 in January.
Question: If the baseline revenue in January 2023 was $10,000, what would the expected revenue be in December 2023?
Example: Multiplicative Model
Using the given trend and seasonal components, we can write our time series decomposition as:
\(Y_{Dec} = (10,000 \times 1.05^{11}) \times 1.2 \times R\)
- $10,000 is the baseline sales in January 2023. This is included because it is the initial sales before any trend, seasonal, or random effects are applied.
- (\(1.05^{11}\)) represents the compounded growth over 11 months. Each month, the revenue increases by 5%, so we apply this growth rate cumulatively.
- 1.2 is the seasonal effect for December. December sees a 20% increase due to seasonality.
- \(R\) is a random variation (which we assume is 1 for now).
Answer: \(Y_{Dec} = \$20,524.07\)
Egg Example: Revisited (Multiplicative Model)
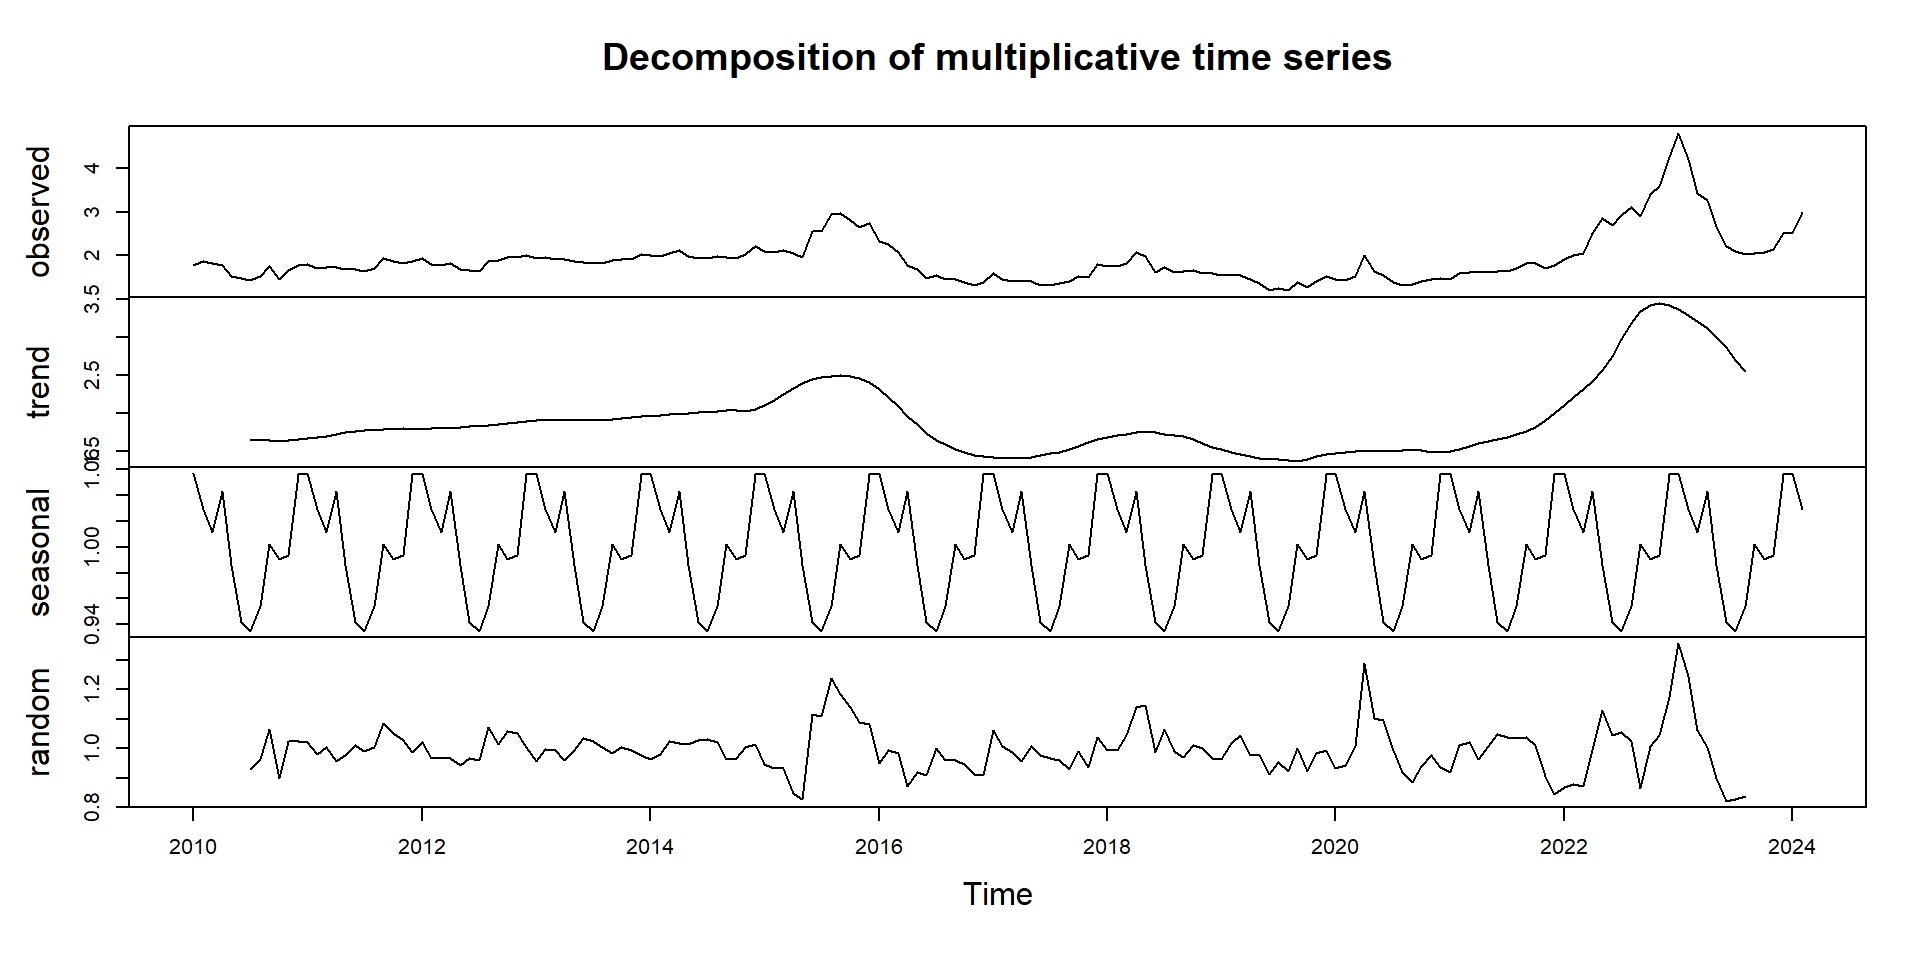
Egg Example: Revisited (Takeaways)
Additive versus Multiplicative?
If egg prices increase over time due to inflation or demand shifts, seasonal peaks and troughs will likely grow proportionally rather than stay constant. A multiplicative model would be more appropriate.
If the seasonal effect remained constant over time, an additive model would be more appropriate.
Interpreting the Results
- Trend Component: The overall direction of the data (upward/downward).
- Seasonal Component: Repeating patterns within a year.
- Random/Residual Component: What remains after removing trend and seasonality.
Using decompose() in R
Now that we understand the components of a time series, how do we extract them from real-world data?
In this week’s lab, we will use R’s decompose() function to break down a time series into its trend, seasonal, and residual components.
Discussion Questions (Partner Activity):
In pairs, think about what question you want to answer with time series decomposition and forecasting.
- Which time series datasets would be most useful for your group’s research question?
- How would time series decomposition help you analyze the dataset to answer your question?
- How would forecasting provide data-driven insight for the decision-maker?
When choosing your time series data for the project, consider the type of decision-makers who would benefit from your analysis.
Here is a scenario to help guide your choice
Context: Suppose you are advising a grain processing company that wants to maintain a stable supply of raw materials for the next five years.
Decision To-Be-Made: They need to decide which grain (corn, wheat, or soybeans) to invest in based on future price trends.
Possible time series choices
- Historical Corn Prices (Monthly, FRED Database)
- Used to track long-term price trends and forecast future prices.
- Helps the company decide if corn is a stable and profitable investment.
- Soybean Export Volumes (USDA Reports, Quarterly)
- Can indicate global demand trends and potential supply chain risks.
- Helps in assessing whether soybeans will remain a competitive option.
- Wheat Production Forecasts (FAO, Annual Reports)
- Provides data on expected future supply based on weather and policy conditions.
- Helps the company determine if wheat will face shortages or surpluses in the coming years.
Recap
- Decomposition separates time series into trend, seasonality, and residuals.
- Understanding these components improves forecasting accuracy.
- Discuss how these insights apply to your group project.
Next: Implement decomposition in this week’s lab!
REMINDER: Project 1
Groups of 2 (Sign up for your Project 1 group on Canvas)
Choose an ag biz or enre management question to answer with time series data
Collect time series data
Analyze trends
Generate a forecast
Present results in a recorded video