Week 8:
Project Overview and Example
Agenda
Project 1 reminder and details
Example project walk-through using carrot price data
Project Overview
Three parts:
Presentation video
Written report (added to your website)
Peer evaluation
Your project should tell a data-driven story.
- Grab audience with a hook
- Provide context and pose a question
- Answer the question using your analysis
Example Project: Will Carrot Prices Continue to Rise?
Context
We are analysts at The Carrot Project.
You are growers attending a workshop.
Carrots are delicious, versatile, and a healthy source of Vitamin A

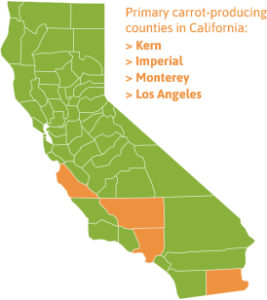
Carrots are a major specialty crop with the majority produced in California

However, carrot prices have been rising

Trend (orange) calculated from STL decomposition using LOESS. The Producer Price Index (PPI) program measures the average change over time in the selling prices received by domestic producers for their output.
Will prices continue to rise or will they return to past trends?
Objective
We will evaluate trends and possible causes.
We will use decomposition to separate trends, seasonality, and residuals.
We will forecast future prices using a statistical model.
Analysis plan
Explore the data by visualizing trends and identifying structural breaks
Decompose carrot prices to understand underlying factors contributing to changing prices, specifically trends, seasonality, and residuals.
Forecast carrot prices over the next 5 years to predict trends.
Interpret prediction intervals to evaluate the uncertainty in the forecast.
Connect our findings to industry decisions.
Step 1: Exploratory Data Analysis
Carrot prices over time
Our data come from the Federal Reserve of Kansas (FRED) Economic Data, accessed via API.
The data report historical prices for carrots from 1980 to 2023.
To understand our data, we calculate summary statistics (mean, standard deviation, range) of our data.
Summary Statistics for Carrot Prices
| Statistic | Value |
|---|---|
| Min | 65.0 |
| 1st Quartile | 98.9 |
| Median | 134.3 |
| Mean | 145.4 |
| 3rd Quartile | 186.8 |
| Max | 311.9 |
- The lowest recorded carrot price in the dataset is $65.00.
- The value at the 25th percentile is $98.90, meaning that 25% of the recorded prices are below this level.
- The median of the dataset is $134.30, meaning that half of the data points fall below and half above this price.
- The average carrot price is $145.40.
- The value at the 75th percentile is $186.80, meaning that 75% of the recorded prices are below this level.
- The highest recorded carrot price is $311.90.
Carrot Price Index jumped 45% between July 2006 and September 2006
Step 2: Decomposition
What is driving the increase in carrot prices?

Additive decomposition of PPI
What is driving the increase in carrot prices?
Does the seasonal pattern dominate price fluctuations? No, even though seasonality is present, long-term trends appear more influential.
Is there a clear long-term trend? Yes, prices exhibit a steady upward trend over time.
Are there notable deviations in the residuals? Yes, suggesting external shocks or irregular price movements.
Is it input prices?

Evidence of a structural break in fertilizer prices, same time as carrot prices
Step 3: Forecast
Will prices continue to rise?
We will use an Exponential Smoothing (ETS) model
We will forecast prices for 5 years
Visualizing the forecast

Forecast based on exponential smoothing of components
Step 4: Prediction Intervals
How certain are we in our estimates?
Extract and visualize uncertainty in the forecast
Interpret how external factors could impact the forecast range
Step 5: Discussion
Important Takeaways for Industry
Carrot prices are near all time highs.
If current trends continue, prices could rise further.
If trends stabilize, prices may level off but remain high.
External factors like fertilizer cost, demand, and seasonality are important factors contributing to price movements.
How This Connects to Project 1
Present summary statistics of your data
Use decomposition to analyze trends and seasonality
Construct a forecast and estimate prediction intervals
Interpret the results and discuss assumptions
Use the forecast to answer your research question
Make sure your final presentation includes a clear narrative, data visuals, and well-explained conclusions
