Week 9:
Cross-Sectional Data
Agenda
What is cross-sectional data?
Common types of cross-sectional data and vizzes
Analyzing cross-sectional data
Project 2 overview and example
Data Types (Recall)
What is cross sectional data?
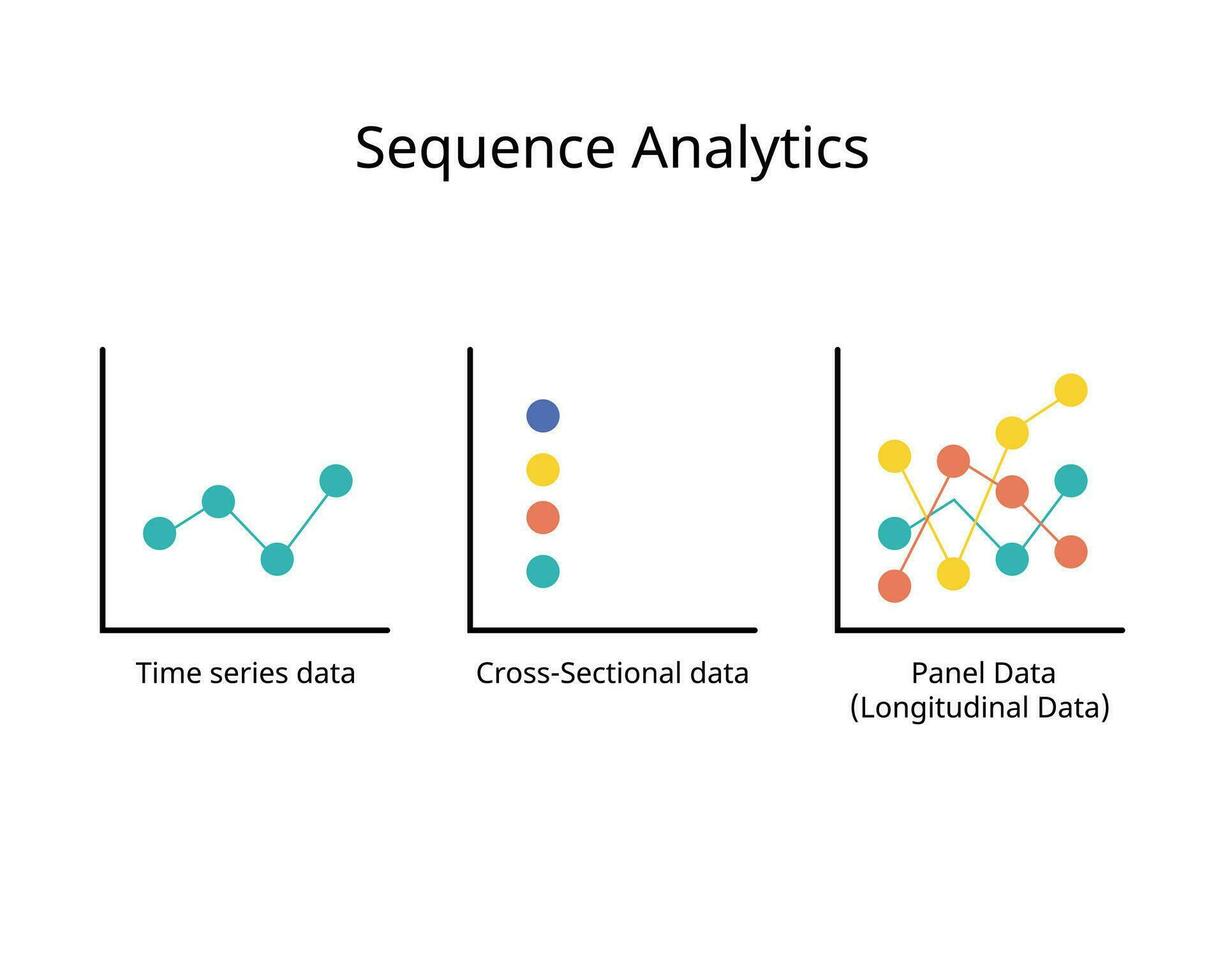
Cross-sectional data is collected by observing a study population at a single point in time or for a period of time and aggregating information to a single observation per subject.
We call it cross-sectional data because we are observing information for a slice, snapshot, or cross-section of a group subjects.
This differs from time series data in that we only observe information at a single point in time.
Common types of cross-sectional data
- Individual-level data
Common types of cross-sectional data
Individual-level data
Business or point of interest-level data
Common types of cross-sectional data
Individual-level data
Business or point of interest-level data
Country-level data
Region-level data
Spatial data
Analyzing Cross-Sectional Data
Cross-sectional analysis typically involves:
- Frequency:
- How common is a certain outcome?
- How many individuals or units are impacted?
- How common is a certain outcome?
- Associations:
- What factors (age, income, location, etc.) are associated with specific outcomes?
- Similarities or Differences:
- Identifying meaningful groups or patterns in data.
One powerful method to uncover these groups is Cluster Analysis, which we introduce next.
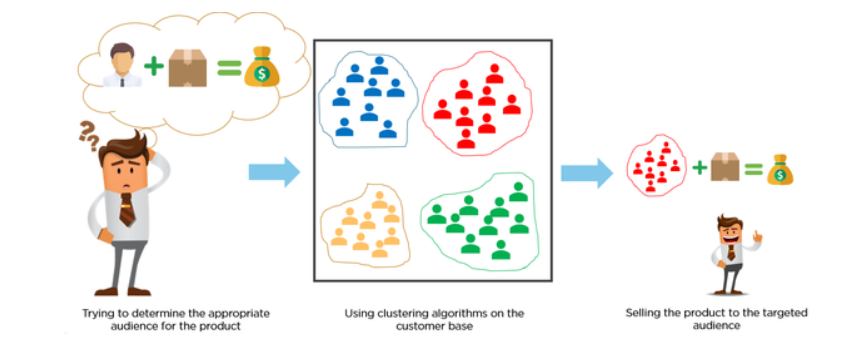
Why Cluster Analysis?
Cluster analysis helps businesses, policymakers, and organizations group similar observations to better understand their characteristics, behaviors, and needs.
For example:
- Retailers use cluster analysis to group similar stores, customers, or products to improve targeting and increase sales efficiency.
- Customers: Segment shoppers by purchasing behavior.
- Stores: Identify which stores perform similarly.
- Products: Group similar products based on performance or consumer preferences.
How does K-means clustering work?
Watch this video on K-means clustering
- The algorithm finds groups (“clusters”) within data by minimizing the distance between observations in each cluster.
- Choose the number of clusters (k) that you want to identify in the data.
- Randomly initialize the k cluster centroids (points in space) within the data range.
- Assign each data point to the nearest centroid, based on the Euclidean distance between the point and each centroid.
- Calculate the mean (centroid) of each cluster based on the data points assigned to it.
- Update the cluster centroids to be the means of the data points assigned to them.
- Repeat steps 3-5 until convergence (when the cluster assignments no longer change or a maximum number of iterations is reached).
Usually, we repeat this whole process a number of times and choose the group assignment that minimizes the overall variance.
After clustering, summarize attributes of the clusters to understand the groups.
Choosing the Optimal Number of Clusters (k)
Two common methods for selecting the right number of clusters:
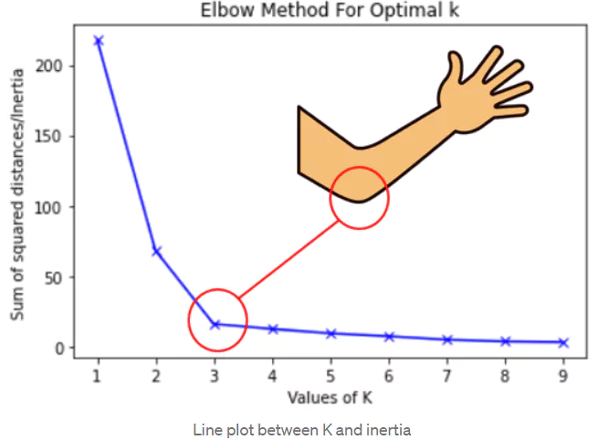
- Elbow Method:
- Measures within-cluster sum of squares (WSS).
- Choose k at the “elbow” where additional clusters don’t substantially improve fit.
- Measures within-cluster sum of squares (WSS).
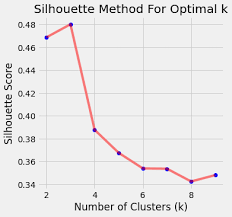
- Silhouette Method:
- Evaluates cohesion within clusters and separation between clusters.
- Choose k with the highest average silhouette score.
- Evaluates cohesion within clusters and separation between clusters.
Example: Customer Segmentation
Suppose you manage convenience stores and want to segment your customers based on purchasing behavior:
- Variables to cluster on might include:
- Total spending per visit
- Average number of items per basket
- Frequency of visits to stores
- Total spending per visit
Example clusters could reveal insights like:
- “Budget-conscious shoppers”
- “Premium buyers”
- “Frequent small-purchase customers”
Goal: Use sales data to divide your customers into groups to better tailor promotions for each customer segment.
Why segment your customers?
We live in a noisy world and crowded marketplace
People are getting better at ignoring and there are more niches
Increase the chances of of reaching the right customers with the right message at the right time
Increase sales, revenue, and hopefully profit
Dimensions of customer segmentation
Identify customer personas
Customer stage - leads, prospects, existing customers
Customer demographics - age, gender, income, location, occupation
Customer behaviors - purchase history, web browsing activity
Example of Cluster Analysis Application
After doing the cluster analysis, you identify three clusters:
| Cluster | Avg. spending | Most frequent purchase | Avg. visits per month |
|---|---|---|---|
| 1 | $4.37 | Cigars | 27 |
| 2 | $16.20 | Water | 6 |
| 3 | $4.25 | Carbonated Soft Drinks | 4 |
Insights:
- Cluster 1: Frequent, low-spend trips for cigars. Use bundle deals to grow baskets.
- Cluster 2: Infrequent but high-spend visits. Target with loyalty rewards.
- Cluster 3: Rare, low-spend visits for soft drinks. Use promos to drive return trips.
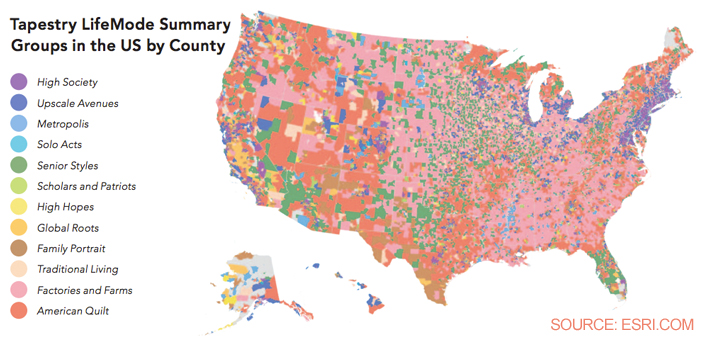
Following customer segmentation, we can create maps like this one…
The ESRI Tapestry Segmentation Example uses cluster analysis on census demographic data (+ others) to define groups.
MetLife Case Study
Customer segmentation analysis
A common application of cluster analysis is to use sales data to divide customers into groups to improve target marketing.
Let’s look at a case study. . .
Connection to Your Project
In your analysis, you’ll:
- Identify segments clearly from cross-sectional convenience store data.
- Characterize each cluster to understand customer/store/product groups.
- Use clusters as a foundation for deeper analysis in Unit 3, where we’ll track these segments over time to see how membership predicts future behavior.
Project 2: Overview
Form groups of 2 (THIS WEEK)
We will provide convenience store data on shoppers, stores, and purchases
Steps of the project include:
- Perform an exploratory data analysis and assemble summary statistics.
- Analyze spatial patterns, correlations, etc.
- Construct visualizations to answer your research question.
- Conduct market segmentation analysis via clustering
- Label clusters based on characteristics
- Develop simple marketing strategy to target clusters