Week 10:
Cross-Sectional Data Analysis
Agenda
Exploring your data
Store segmentation example
Customer segmentation and mapping
Project 2 overview
Exploring your data
Exploratory data analysis
What do we mean when we say explore your data?
\(\rightarrow\) Gain familiarity with the contents of the data
\(\rightarrow\) Identify questions that can be answered with the data
\(\rightarrow\) Generate summary statistics (average, variance, min, max)
\(\rightarrow\) Plot distributions and correlations between variables
Gain familiarity with your data
A good data source will provide information about a dataset in the form of a data dictionary.
A data dictionary is a comprehensive guide that provides detailed information to the data analyst about the dataset being analyzed.
Can include:
Variable names
Data types
Descriptions
Possible values
Missing value indication
Data source
Identify questions that could be asked
Which stores have the greatest number of unique shoppers?
What is the average length of time a shopper remains in a store?
How far do shoppers travel to a store during a weekday?
What time of day is the busiest time to shop on a Saturday and a Sunday?
Summary statistics
Summary statistics provide an overview of the data’s main characteristics.
They are important for understanding the data’s scope and identifying possible outliers.
What summary statistics would we want to report if we were to answer the following question:
How do stores vary in terms of customer traffic and product diversity?
Summary statistics
How do stores vary in terms of customer traffic and product diversity?
Average number of unique customers (mean): Shows how many individual shoppers typically visit a store during the month. Stores with higher values likely serve a broader customer base or higher-traffic locations.
Average product diversity (mean): Reflects the average number of distinct products sold per store. A higher number suggests broader assortments, while lower numbers could signal specialization (e.g., fuel-focused or small-format stores).
Summary statistics
How do stores vary in terms of customer traffic and product diversity?
- Range of unique customers and product diversity (min and max):
Minimums may represent underperforming or rural locations.
Maximums could indicate high-volume stores or those in dense areas.
- Standard deviation (variation): For both variables, this tells us how much stores differ from one another:
A high standard deviation in unique customers suggests variation in store foot traffic — some serve many more shoppers than others.
A high standard deviation in product diversity suggests variation in assortment strategy — from limited selection stores to large-format or multi-category stores.
Plotting distributions and correlations
Distributions
Plotting data allows you to see relationships in the data that cannot be easily identified with summary statistics.
We plot distributions for a single variable:
Allows you to see patterns, anomalies, and spot outliers in the data
The shape of the distribution informs whether you will need to transform the data (e.g., take the log)
Correlations
We plot correlations between two variables:
Discover relationships between two variables and use this to inform a hypothesis
Highly correlated data can be problematic and plotting correlations can detect these relationships
What is ggpairs()?
The ggpairs() function comes from the GGally package in R and is a powerful tool for visualizing relationships between multiple variables at once.
Think of it as a matrix of plots that lets you:
Quickly explore distributions of individual variables
See pairwise relationships between variables
Identify potential correlations, outliers, and redundancy
Example: Store Segmentation
I’m interested in using cluster analysis to segment the sales data by stores.
I believe the following variables capture differences in store behavior.
- Unique visitors (
customers) - Total sales (
sales) - Product mix (
products) - Store scale (
chain_size) - Store type/specialization (
fuel_share)
I want to visualize these variables to see if they adequately capture differences between the stores.
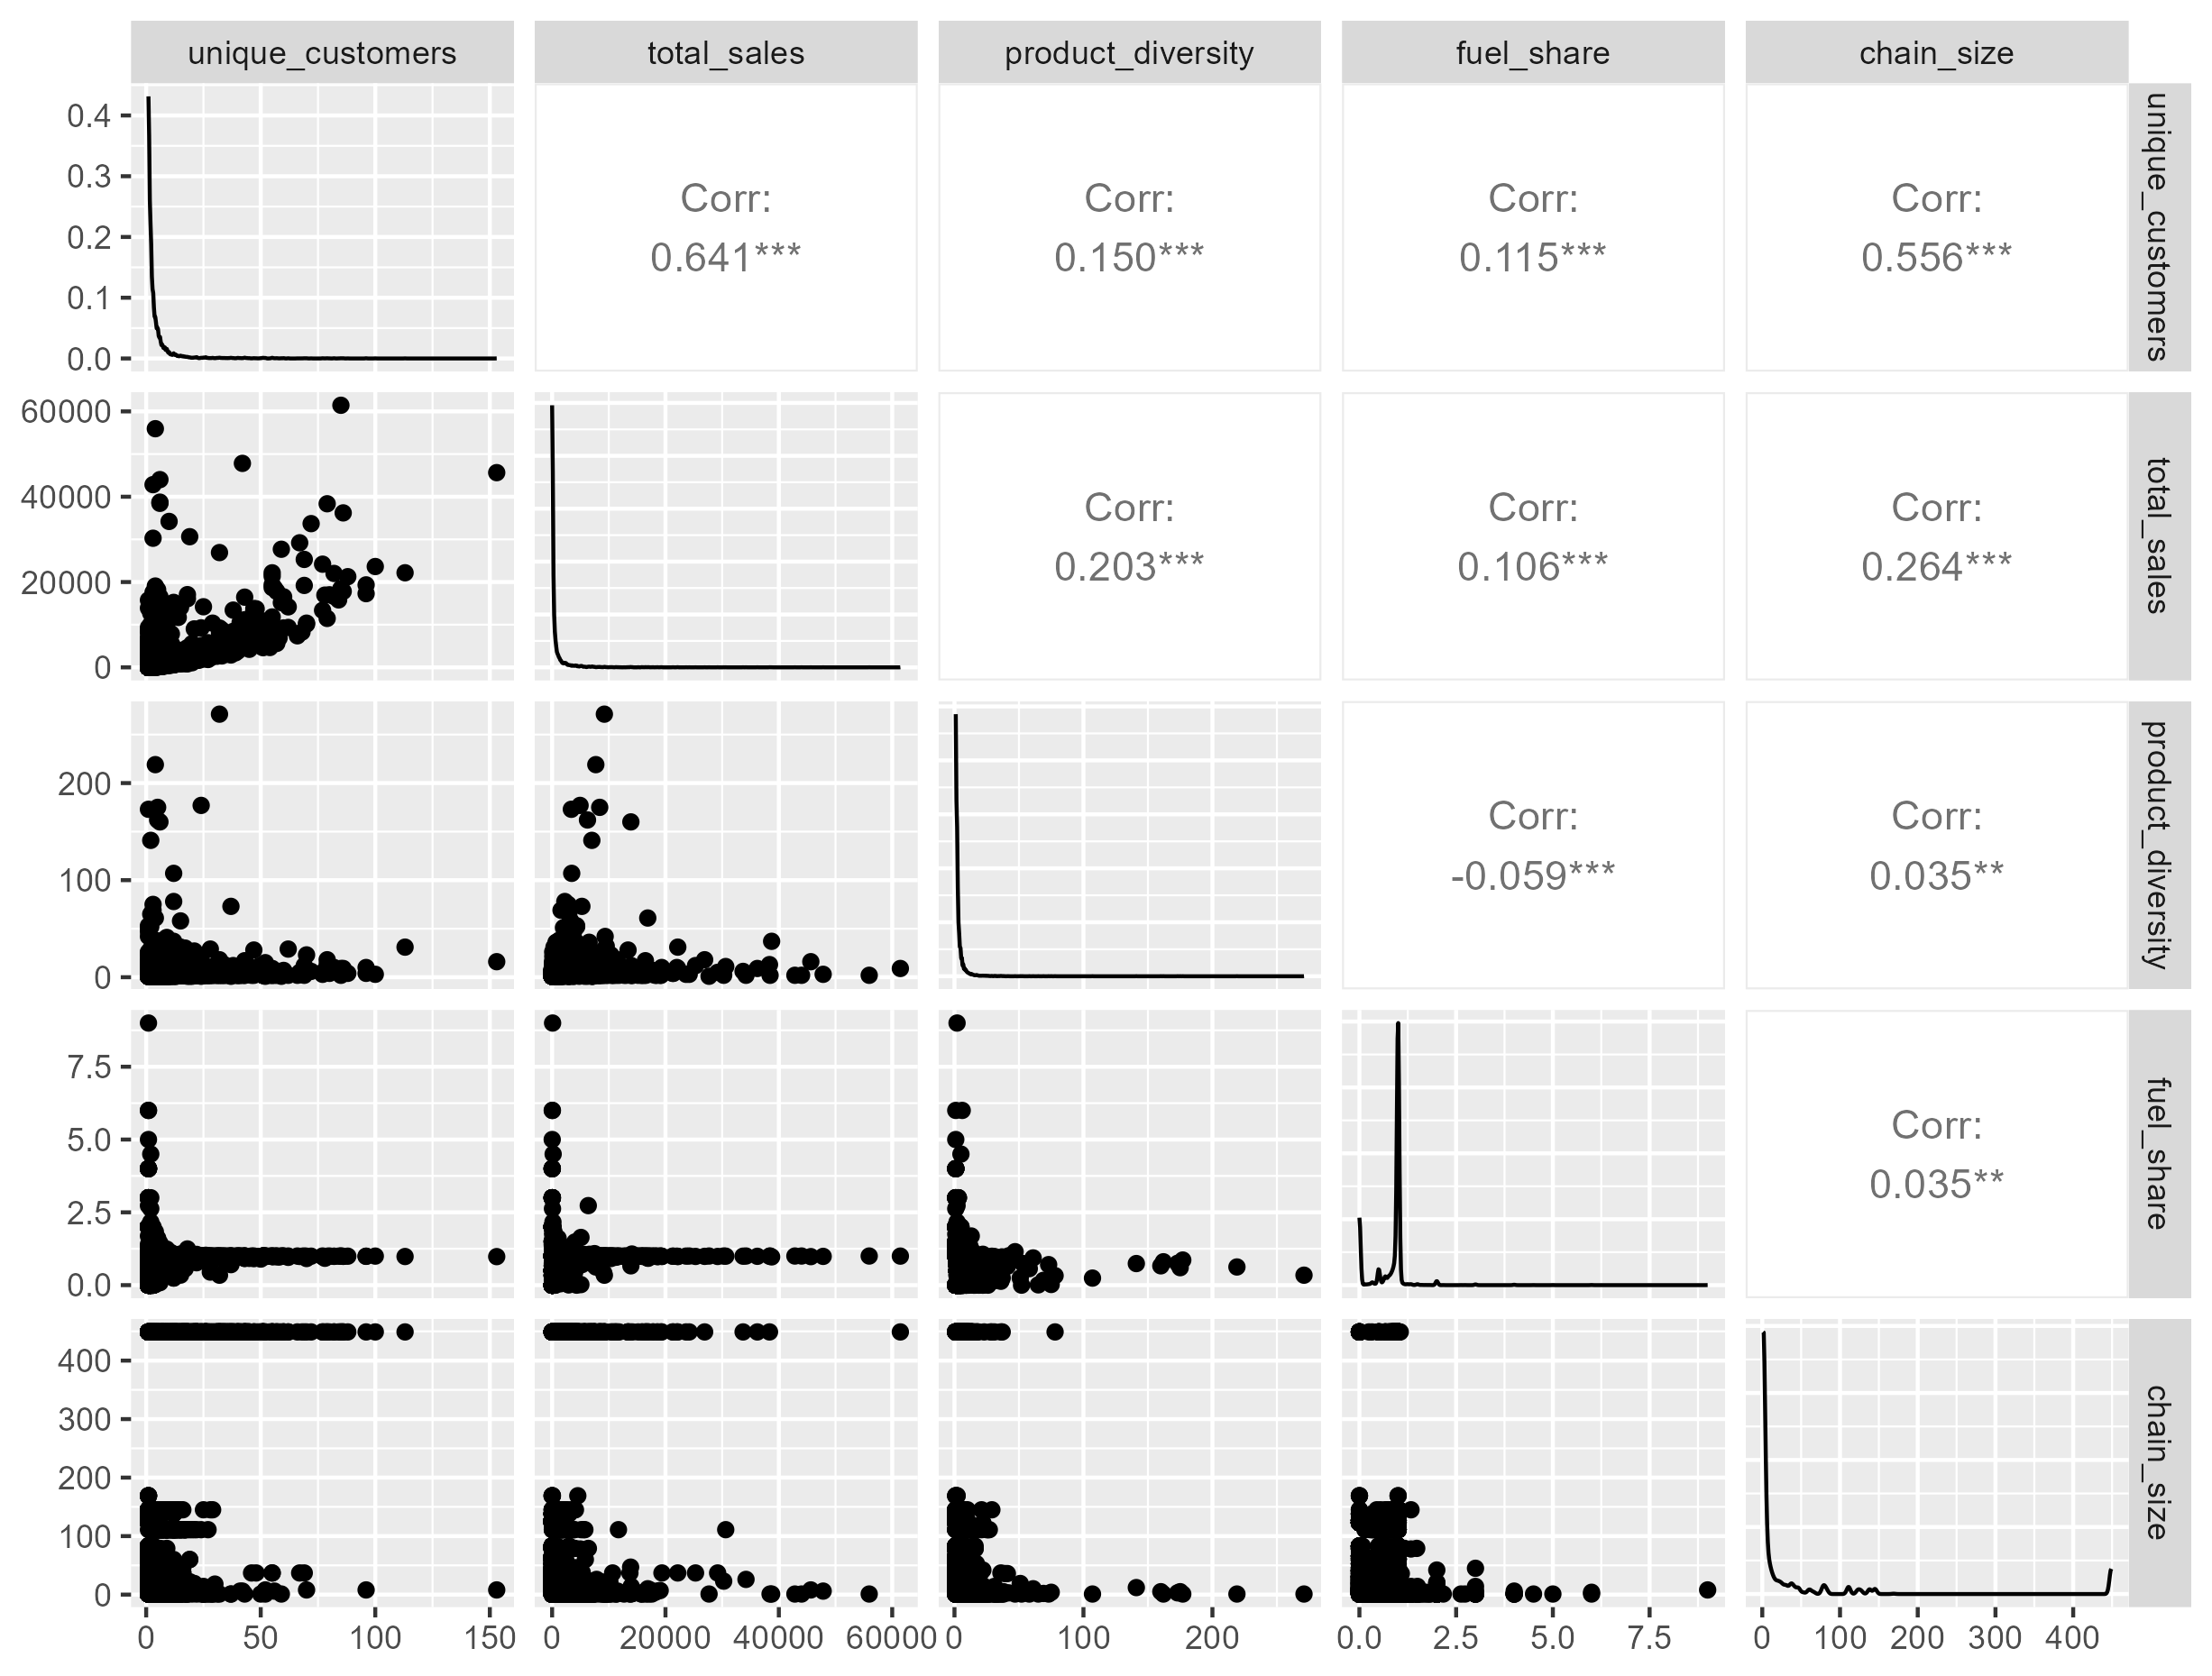
I use ggpairs() to visualize the relationships between the variables
library(GGally)
ggpairs(final_dataset %>% select(customers, sales, products, chain_size, fuel_share))
It produces a grid with the following structure
customers |
sales |
products |
… | |
|---|---|---|---|---|
customers |
Histogram | Correlation | Correlation | … |
sales |
Scatterplot | Histogram | Correlation | … |
products |
Scatterplot | Scatterplot | Histogram | … |
| … | … | … | … | … |
Diagonal: Histograms or density plots for each individual variable
Lower triangle: Scatterplots showing relationships between variable pairs
Upper triangle: Correlation coefficients between each variable pair
How to read this output
The first thing I look at are the diagonals: How are my variables distributed?
- I see that the variables are skewed right1
- I decide to “log transform” the variables (except fuel share)
My new set of potential cluster variables is now:
- Unique visitors (
log_customers) - Total sales (
log_sales) - Product mix (
log_products) - Store scale (
log_chain_size) - Store type/specialization (
fuel_share)
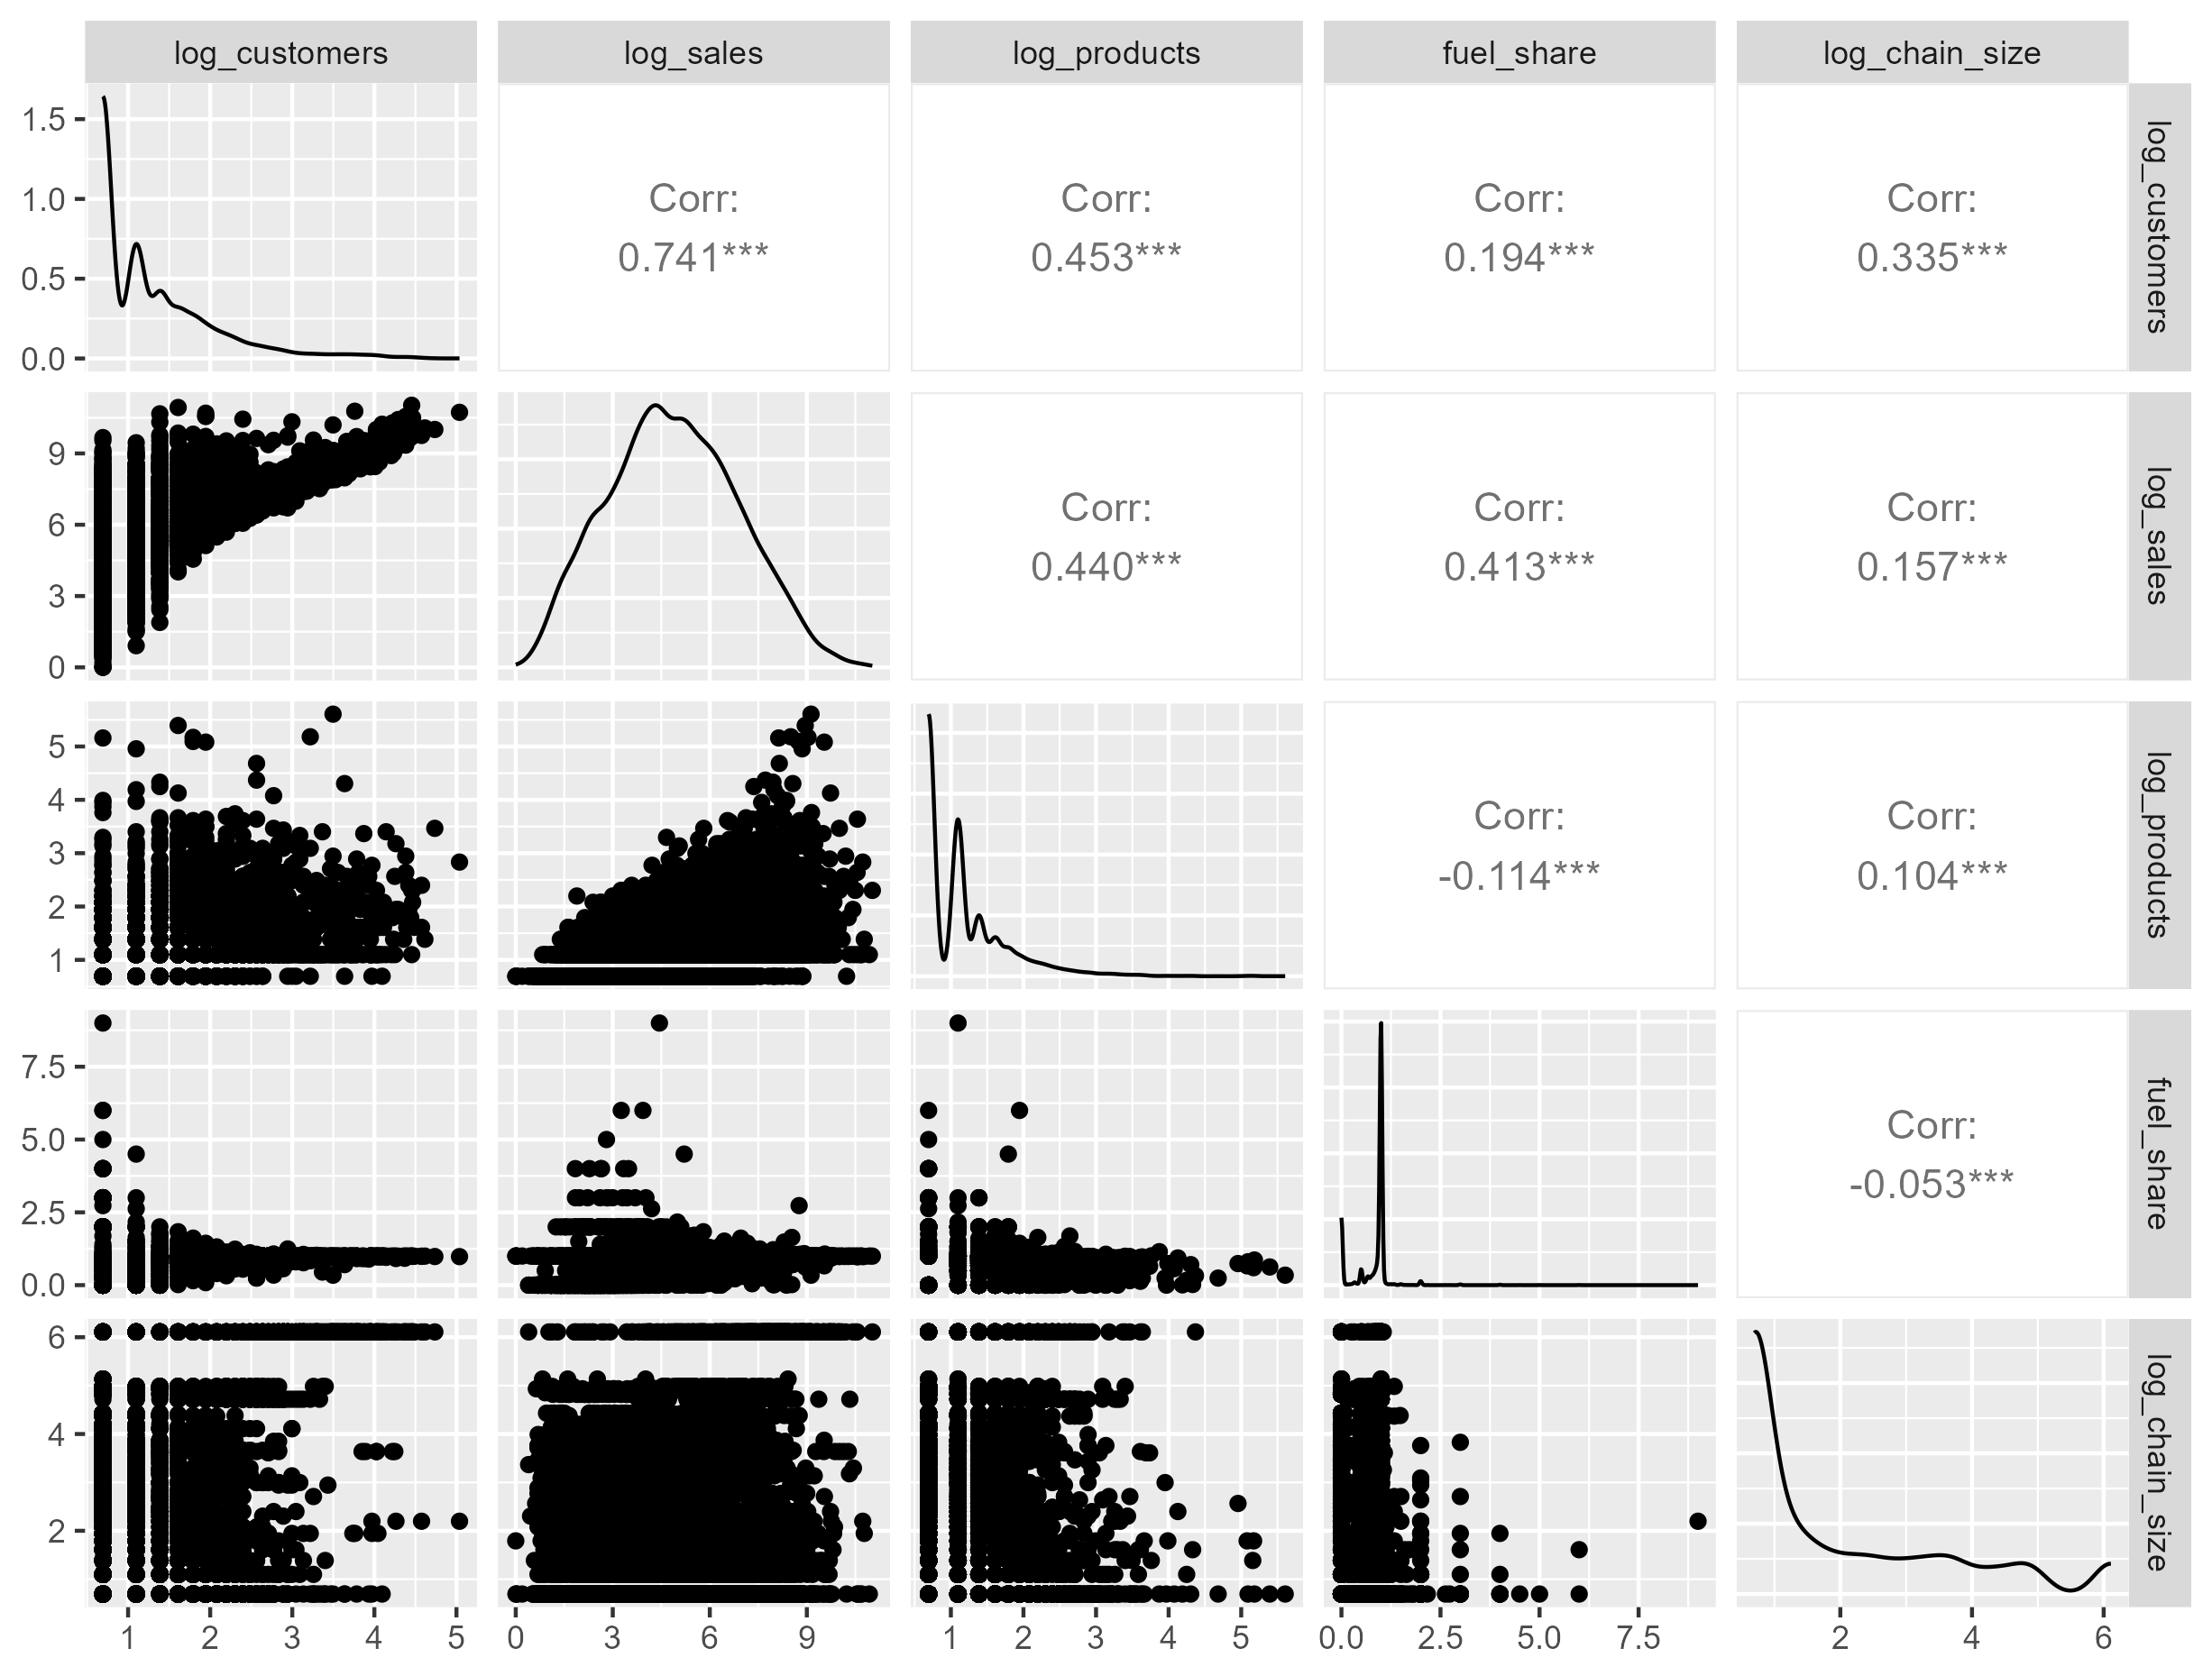
How to read correlation coefficients
| Variable Pair | Corr | Interpretation |
|---|---|---|
log_customers ~ log_sales |
0.741 | Strong positive relationship. Stores with more customers tend to generate more total sales (as expected). |
log_customers ~ log_products |
0.453 | Stores with more product variety attract more customers. |
log_customers ~ log_chain_size |
0.335 | Bigger chains tend to have more customers per store. |
log_sales ~ log_products |
0.44 | Stores with more diverse products tend to sell more overall. Suggests product variety drives revenue. |
log_sales ~ fuel_share |
0.413 | Stores with higher sales also have higher share coming from fuel. |
log_products ~ fuel_share |
-0.114 | Slightly negative: stores that sell mostly fuel may offer fewer product types. |
We want to make sure none of our correlations are close to 1, as that would indicate collinearity. If you find a perfectly collinear variable (or close to +/- 1), remove one.
Overall takaways
- Log transformations helped reduce extreme skew and made relationships between variables easier to see.
- Still a bit right-skewed even after log transformation.
- Most correlations are moderate and positive — indicating your clustering variables are related but not redundant.
- No obvious collinearity problems (no correlations near 1).
- No variable appears redundant — good news for clustering.
- There’s decent variation across stores, which is ideal for segmentation.
Why this matters
Before running a segmentation algorithm like K-means, you want to:
- Check for multicollinearity — avoid overly redundant inputs
- Make sure variables are on similar scales (e.g., using log or standardization)
- Choose variables that add unique information about store behavior
In lab this week
Perform cluster analysis by stores in R
Map store location data in Tableau and assign cluster information
Project 2
Project 2: Overview
Use the data provided to:
Perform an exploratory data analysis
Assemble summary statistics
Analyze spatial patterns, correlations, etc.
Construct visualizations
You must:
Conduct market segmentation analysis via clustering (customer, store, or product)
Label clusters based on characteristics
Develop a simple marketing strategy to target clusters
Project 2: Data
Overview: Transaction-level data from convenience stores across the U.S. during July of 2023
A transaction is defined as a purchase incident made by a shopper. (Think: receipt)
Transaction-level data includes information about the store where they made the purchase, the price and quantity of the products they purchased, and details about the items they purchased.
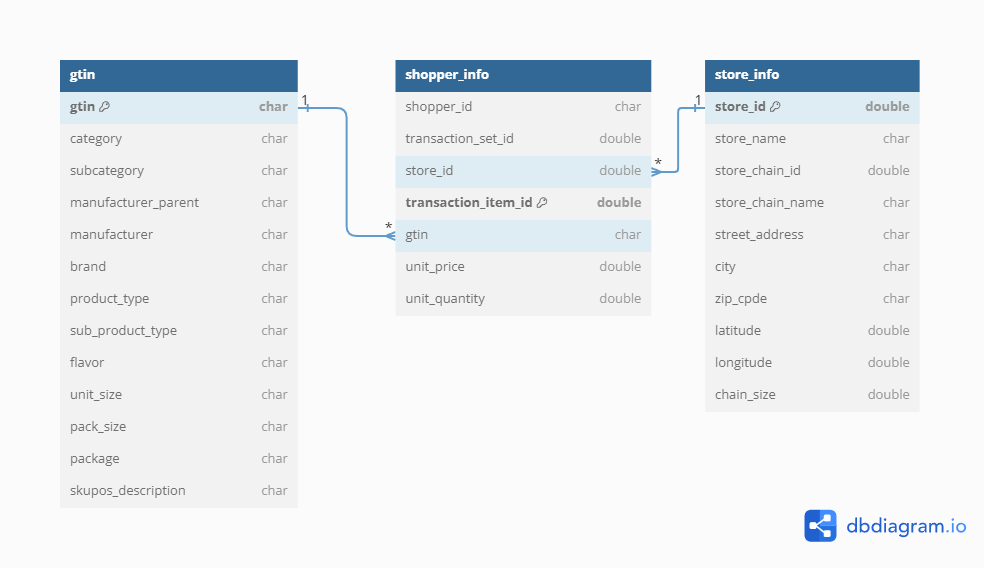
Project 2: Data
“shopper_info.csv”
- This is the core file that contains information about the shopper and each transaction they made during the month of July 2023.
“gtin.csv”
You will link this file with “shopper_info” based on the variable gtin.
GTIN stands for “Global Trade Item Number” and is similar to an SKU or UPC (i.e., barcode).
“store_info.csv”
- This file contains the store details and can be linked with the “shopper_info” using the variable store_id.
Project 2: Types of segmentations
By store:
Which stores are similar by mix of products sold?
Which stores are similar by sales?
By product:
- Which products are similar?
By shopper:
Which shoppers are similar based on where they shop?
Which shoppers are similar based on what they purchase?
Summary
Explore your data: understanding your data, identifying questions, descriptive statistics, plotting distributions, plotting correlations