Project 2: Where are Migrant Agricultural Workers?
Before We Begin…
Who Am I?
I am a researcher with expertise in the employment patterns of U.S. agricultural workers.
Who Are You?
You are a group of government and non-profit employees from organizations like the National Migrant and Seasonal Head Start Association, the U.S. Department of Labor, and the CO Department of Labor and Employment.
Why are we looking for migrant workers?
The U.S. government has a variety of publicly-funded programs aimed at helping migrant and seasonal agricultural workers…
Why do these programs exist?
Having a sufficient number of workers when and where they are needed is vital for our agricultural industry.
But agricultural workers face “chronic seasonal unemployment and underemployment.”
Why are we looking for migrant workers?
The U.S. government has a variety of publicly-funded programs aimed at helping migrant and seasonal agricultural workers…
Why are we looking for migrant workers?
The U.S. government has a variety of publicly-funded programs aimed at helping migrant and seasonal agricultural workers…
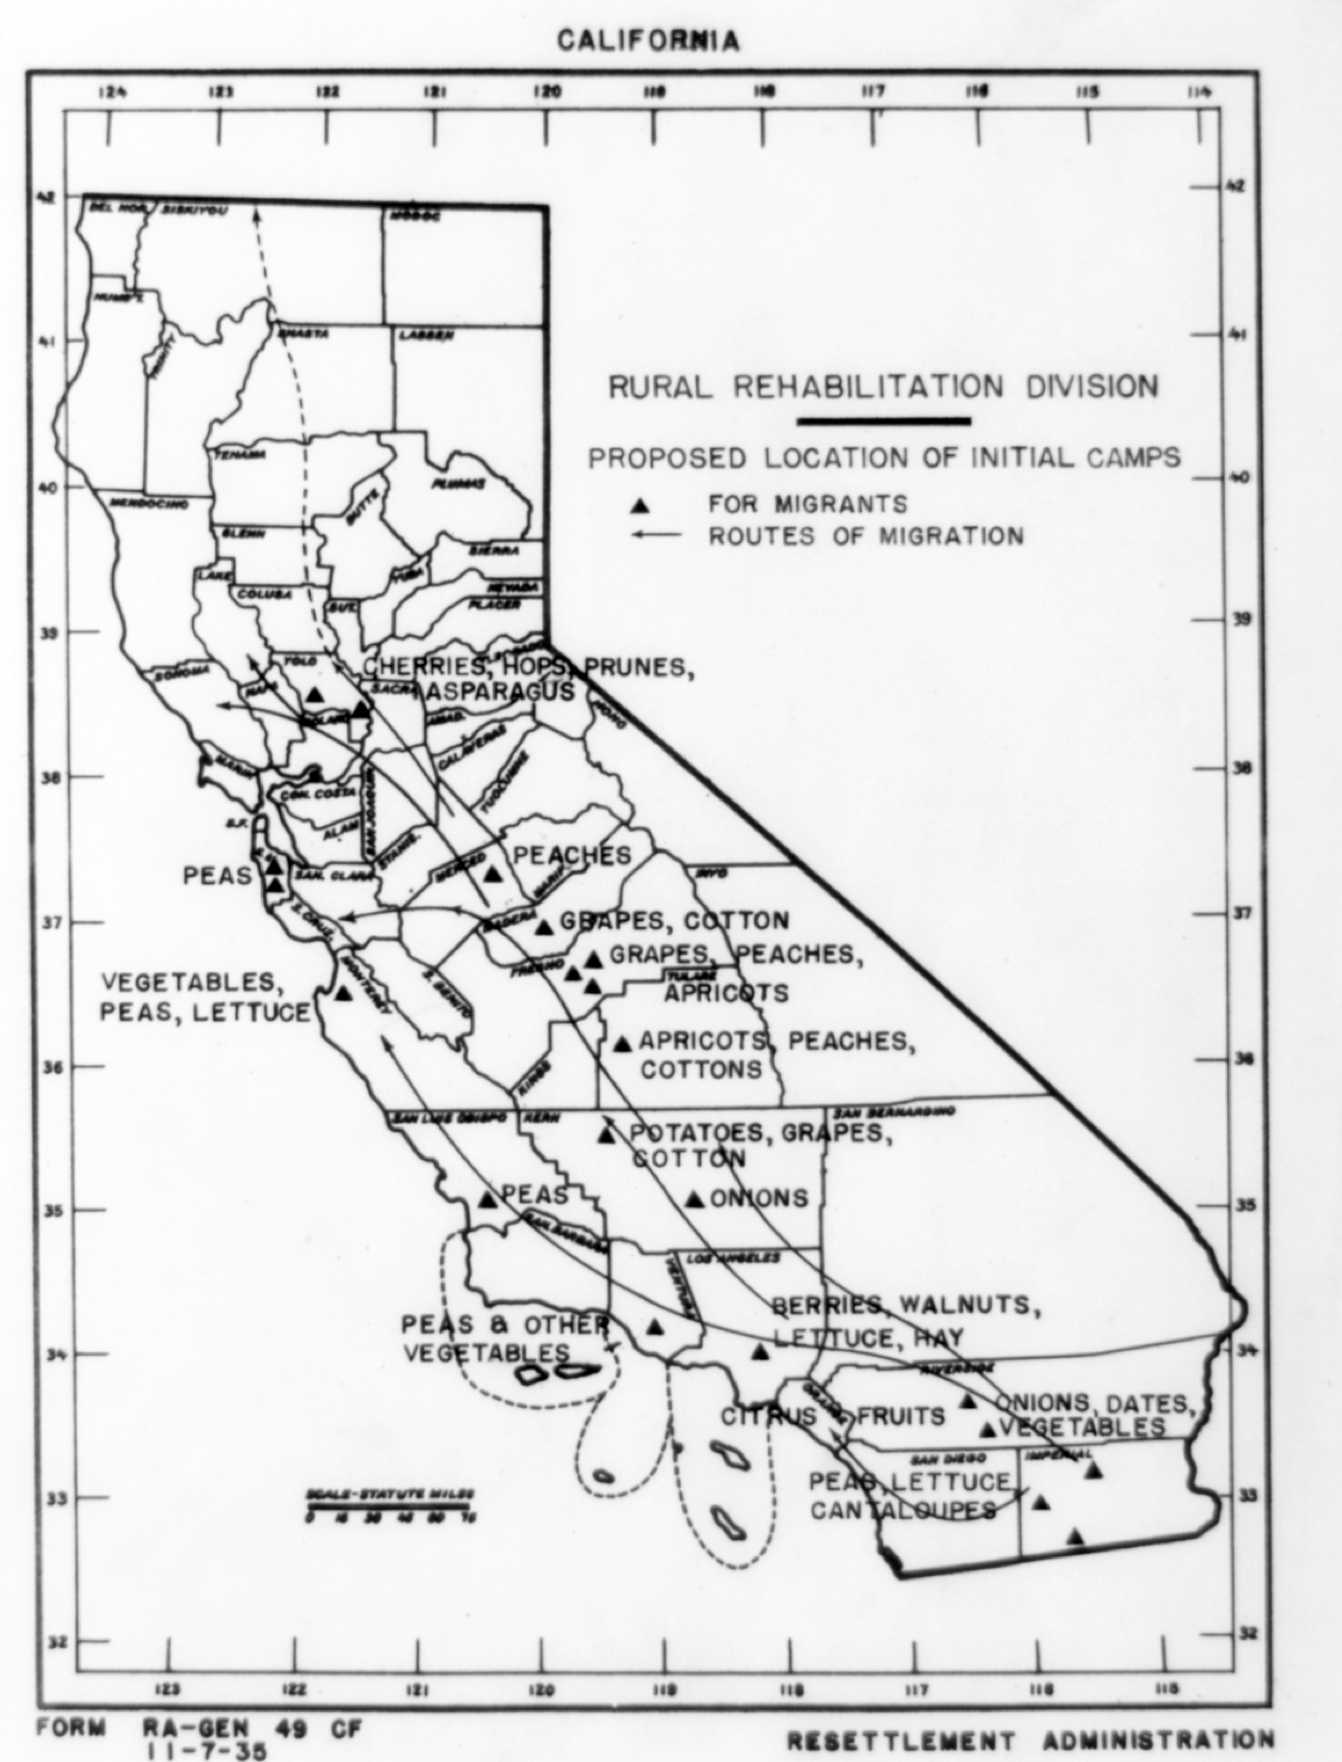
Historically, these programs have located offices and staffed according to migrant flows.
An example of historic migrant flows

Why are we looking for migrant workers?
The U.S. government has a variety of publicly-funded programs aimed at helping migrant and seasonal agricultural workers…
Historically, these programs have located offices and staffed according to migrant flows.
But; now they aren’t successfully finding very many migrant workers.
The Question:
Where can we find
migrant ag workers?
How will we answer this Q? The Data.
The National Agricultural Workers Survey (NAWS)
The only nationally-representative survey of U.S. agricultural workers
Workers are interviewed at their place of employment
- This mitigates issues faced by household-based surveys in finding ag workers
Workers provide their work history, including the county and dates of employment, for all jobs in the past year.
How will we answer this Q? The Analysis
I will use a cluster analysis to answer this question.
Why? I want to construct groups of counties that are “related” in terms of where groups of workers choose to work.
I will call these clusters “labor sheds” and they represent geographical areas in which workers are willing to mgirate within to work farm jobs.
How will we answer this Q? The Analysis
I will use a cluster analysis to answer this question.
How? First I will create a measure of how related/linked two counties are in terms of the number of workers who have worked in both counties. Geographers typically call this measure “proportional flow”:
\[ \frac{C_{ij}}{\min\left( W_i, W_j \right)} \]
Where \(C_{ij}\) is the number of workers who worked in both county i and j and \(W_i\), \(W_j\) are the number of (distinct) workers who worked in county i, j.
How will we answer this Q? The Analysis
I will then use two variables to create clusters of counties that are “related”
proportional flow (the one I created)
an indicator for whether two counties are adjacent
Assumptions, limitations, and future work
Workers provide accurate information on their employment
Workers are more likely to migrate following a path of adjacent counties
The analysis only includes crop workers
Policy-makers need more refined geographical information than this to know where to locate offices, but this is not feasible with available data
Future work should conduct targeted surveys within labor sheds to locate specific agricultural areas and assess worker needs
Results: I Identified 8 Labor Sheds
What to do with this information?
Policy-makers, non-profit employees,
and other stakeholders (in this case, you)
can use my interactive maps to determine
where to locate offices.
How can you use my maps to do this?
Within each labor shed,
identify the counties that
have the most workers each month.