Public datasets (e.g., Census, USDA Cropland Data Layer)
Data Processing and Cleaning
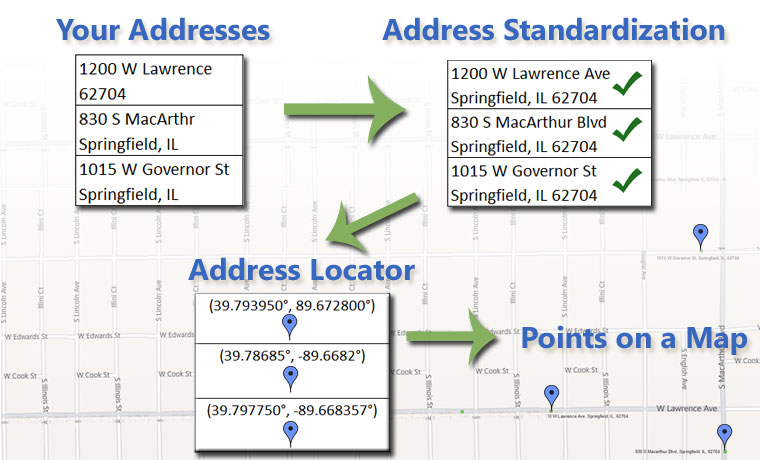
Geocoding and reverse geocoding
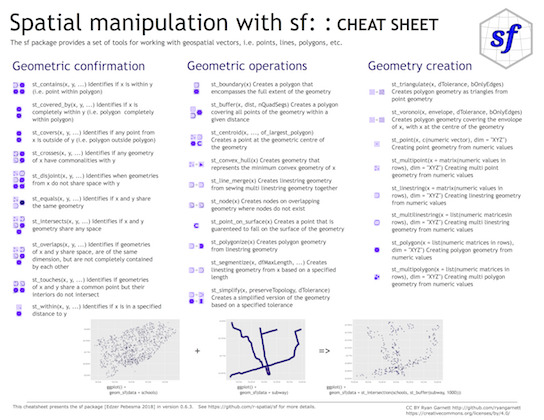
Calculating distance between objects
Calculating area of polygons
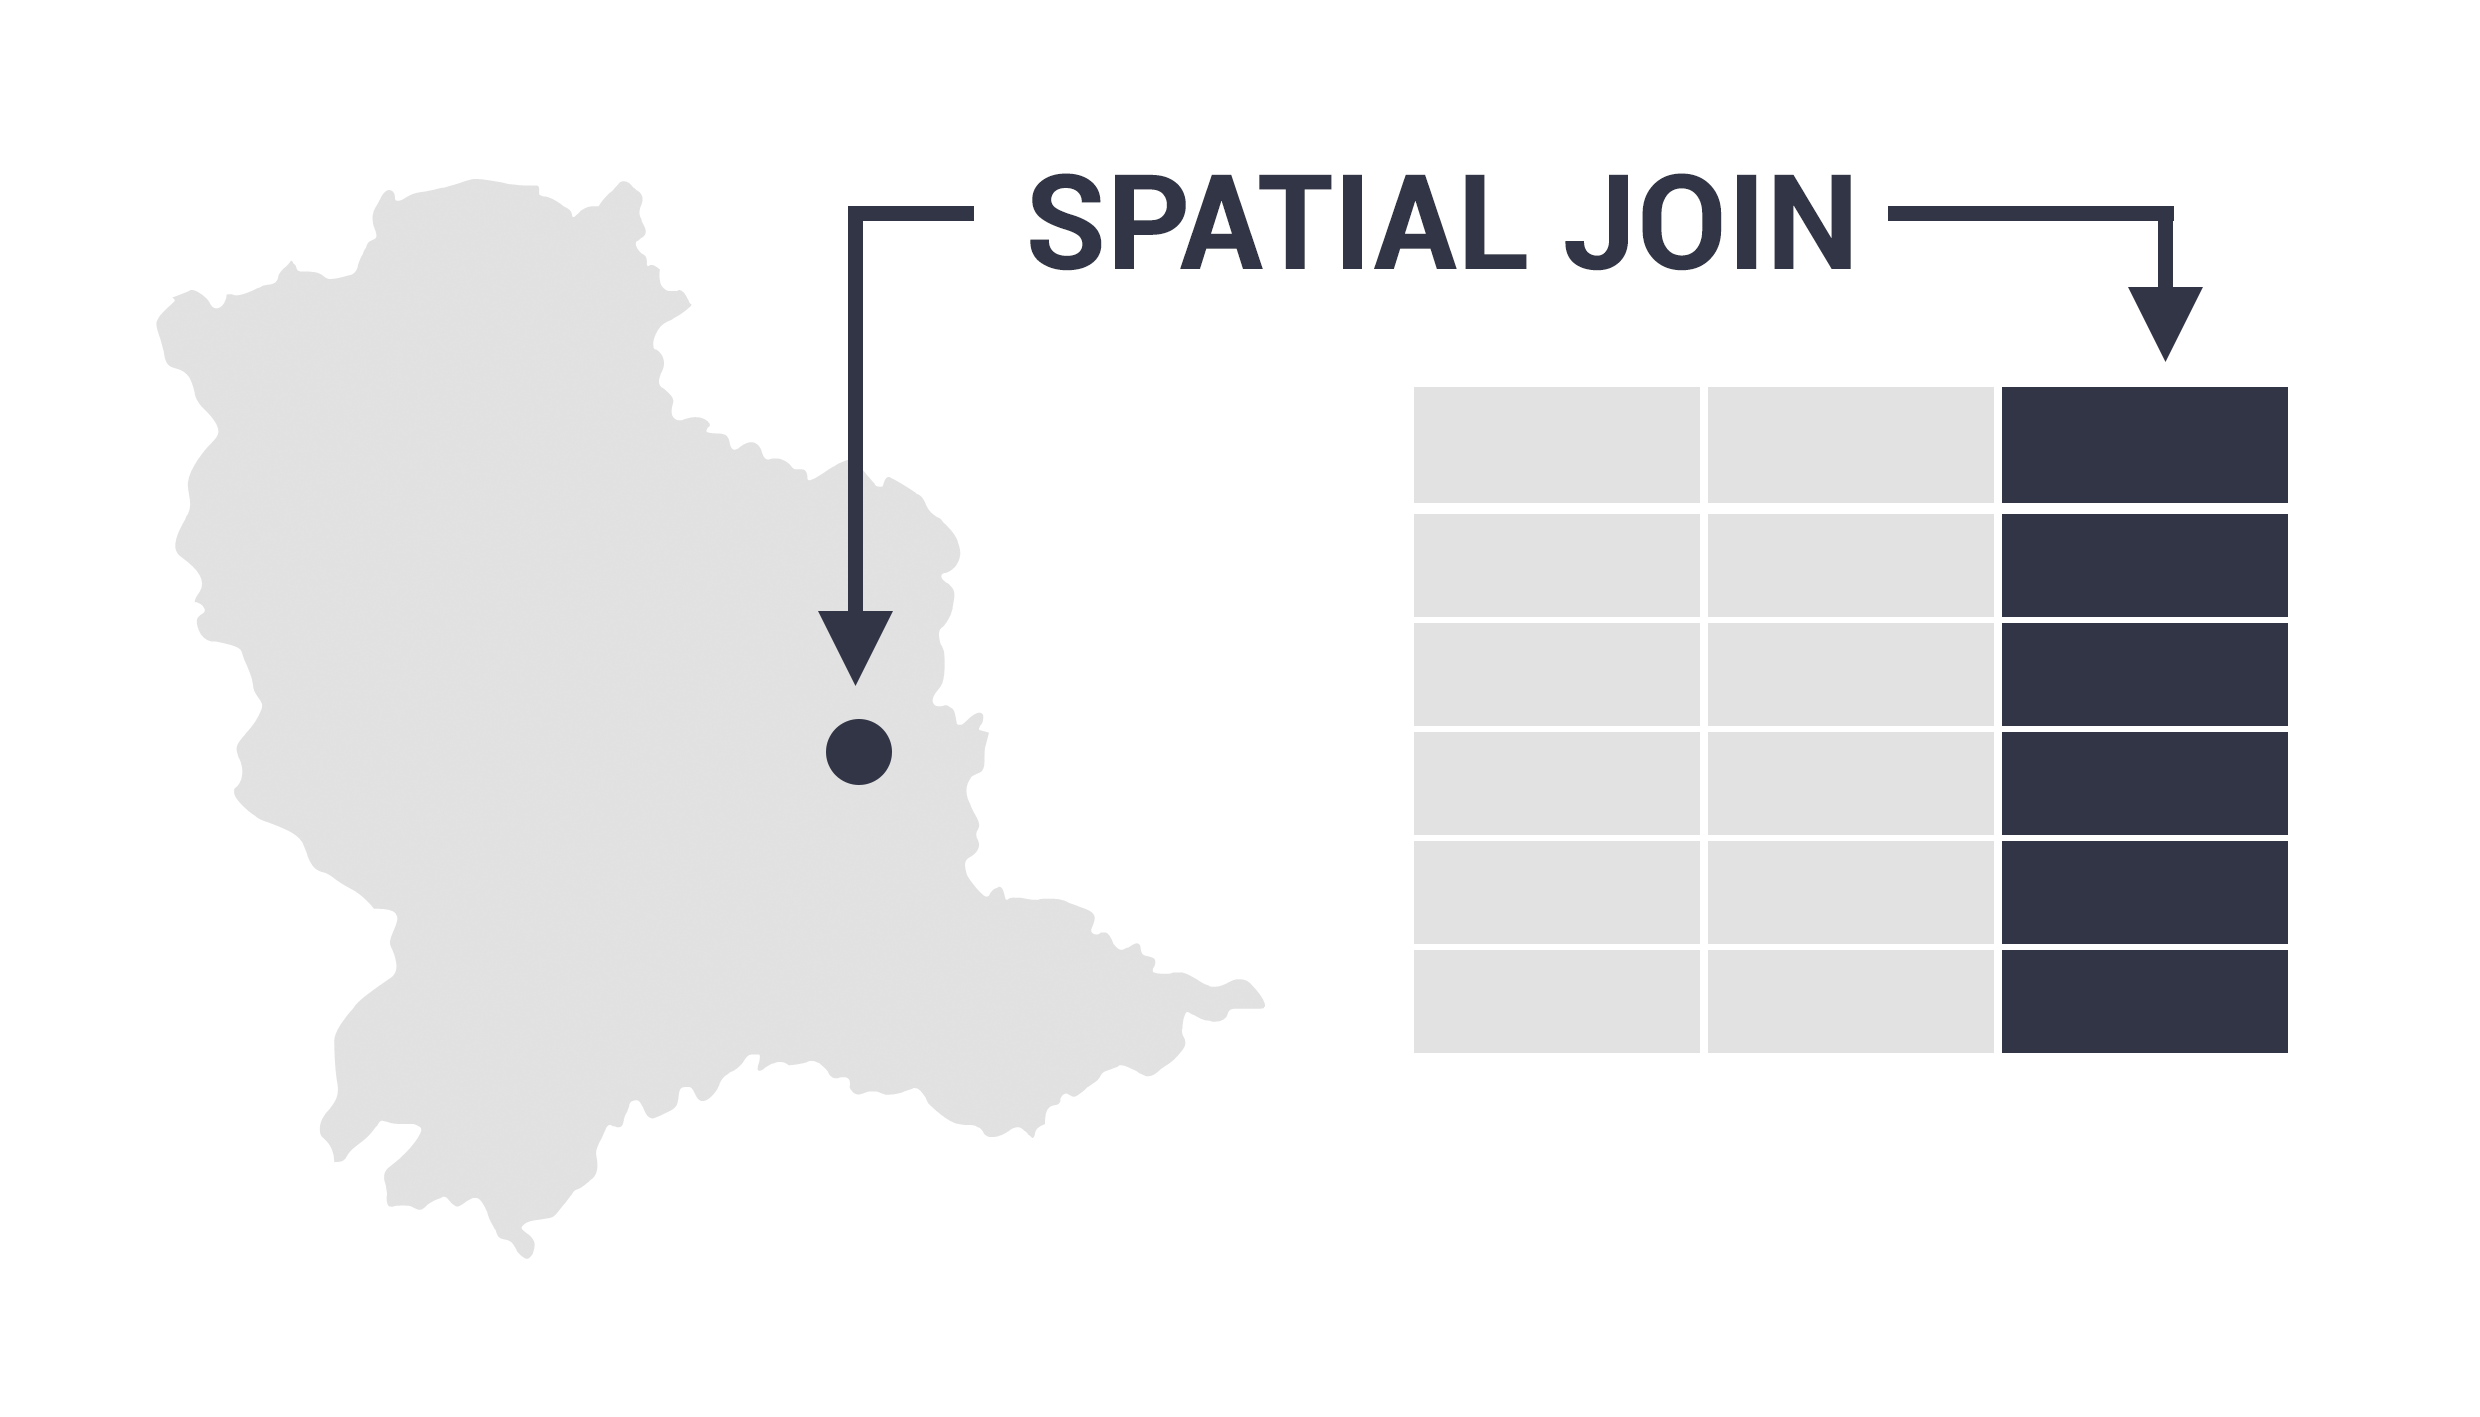
Spatial joins
Geocoding and Reverse Geocoding
Geocoding: Converting an address to a set of coordinates
Reverse Geocoding: The process from coordinates to address
Spatial Joins
Joining data based on shared location
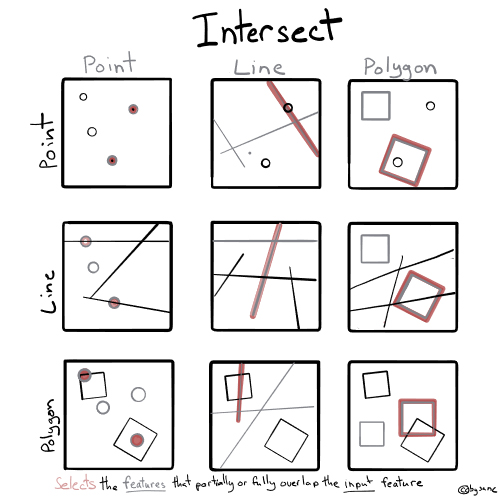
Point to point
Points/lines to polygons
Polygon to polygon (intersecting polygons)
Takeaways
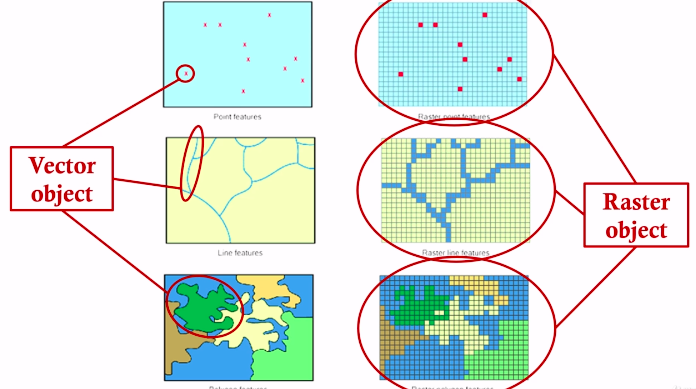
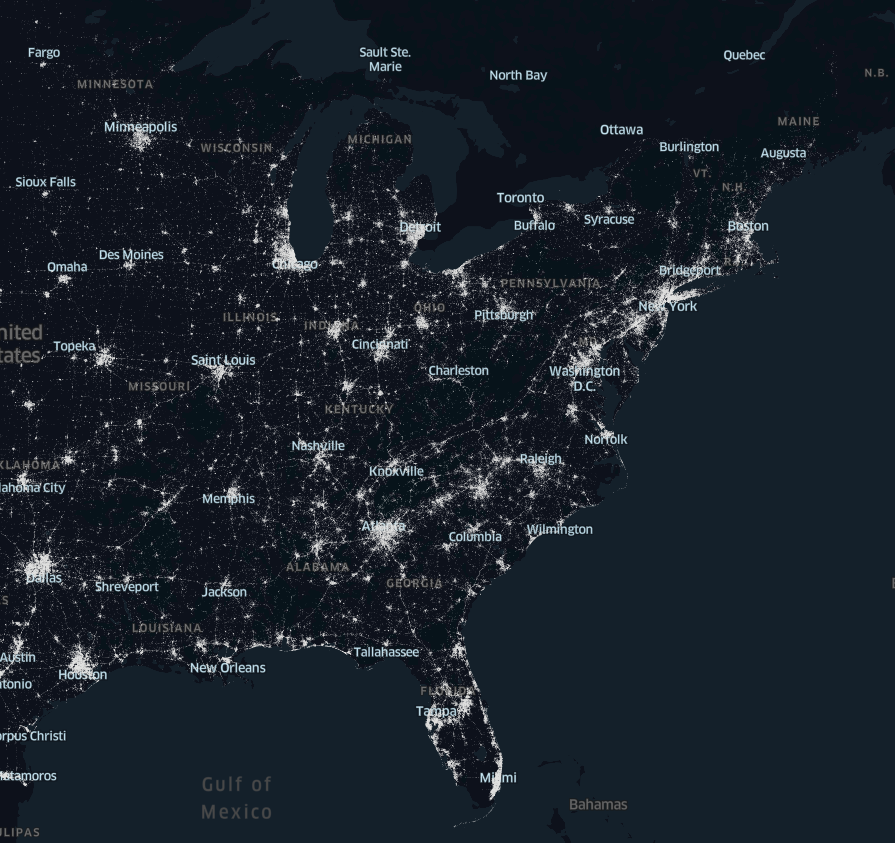
Spatial data references a location
Spatial data enables calculation and manipulation
Spatial information enables joining to other data (e.g., census)
Lab This Week
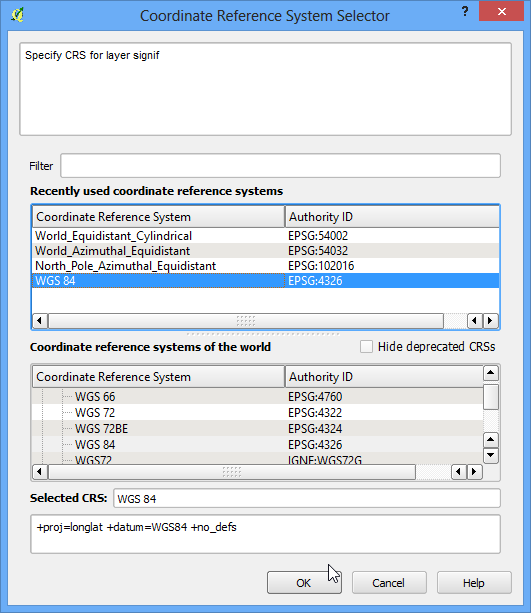
Read and process spatial data in R
Join spatial data
Prepare data for mapping in Tableau
Project 3
The Question
The goal of this project is for you to apply panel data analysis to answer a real world question.
This is also a chance to showcase your creativity and analytic skills, putting everything together that you have learned over the semester.
The Data
For this project, you will use the convenience store data (shopper_info, store_info, gtin) to select your \(y\), and choose one of the two additional datasets (census data or weather data) to choose your \(x\).
Option 1: Convenience store data and Demographic data from the US Census
Option 2: Convenience store data and Weather data from NOAA
Bringing It Together
Your question for project 3 should be in the form of: What is the association between \(x\) (an explanatory variable) and \(y\) (some outcome)?
Choose one of the two options.
Based on your question, determine the outcome (\(y\)) to evaluate from the convenience store data.
Identify the controls (e.g., weather, population density) that you want to include. This (or these) will serve as your treatment or exposure variable(s), \(x\).
Including control variables in the regression explains a portion of the variation in your data leaving your variable of interest to explain the remaining variation.
You are responsible for merging or joining your datasets. This means that you must identify the unit of analysis in your datasets and aggregate data to the common unit of analysis.
Example Questions
Using Census
What is the correlation between population size and total store count at the zip code level?
What is the association between the number of convenience store locations and median income within a county?
What is the association between the number of energy drinks sold and the average age of individuals living in a county?
Using Weather
What is the correlation between total daily rain fall and packaged beverages sales at Allsups locations in Texas?
What is the correlation between the total daily rain fall and total sales in an area?